The DSP data model
DSP is organized around two core concepts: Unit Operations, which represent the process steps in the purification train such as chromatography, hold or viral inactivation, and viral filtration, and Material Streams, which represent the material flowing into and out of each step.
Material streams are also typed, so a stream can be identified as a load, pool, feed, filtrate, eluate, or another process-specific stream type. That relationship between unit operations, streams, and stream types is the foundation for the DSP views described below; see the Library guide for the unit operation definitions.
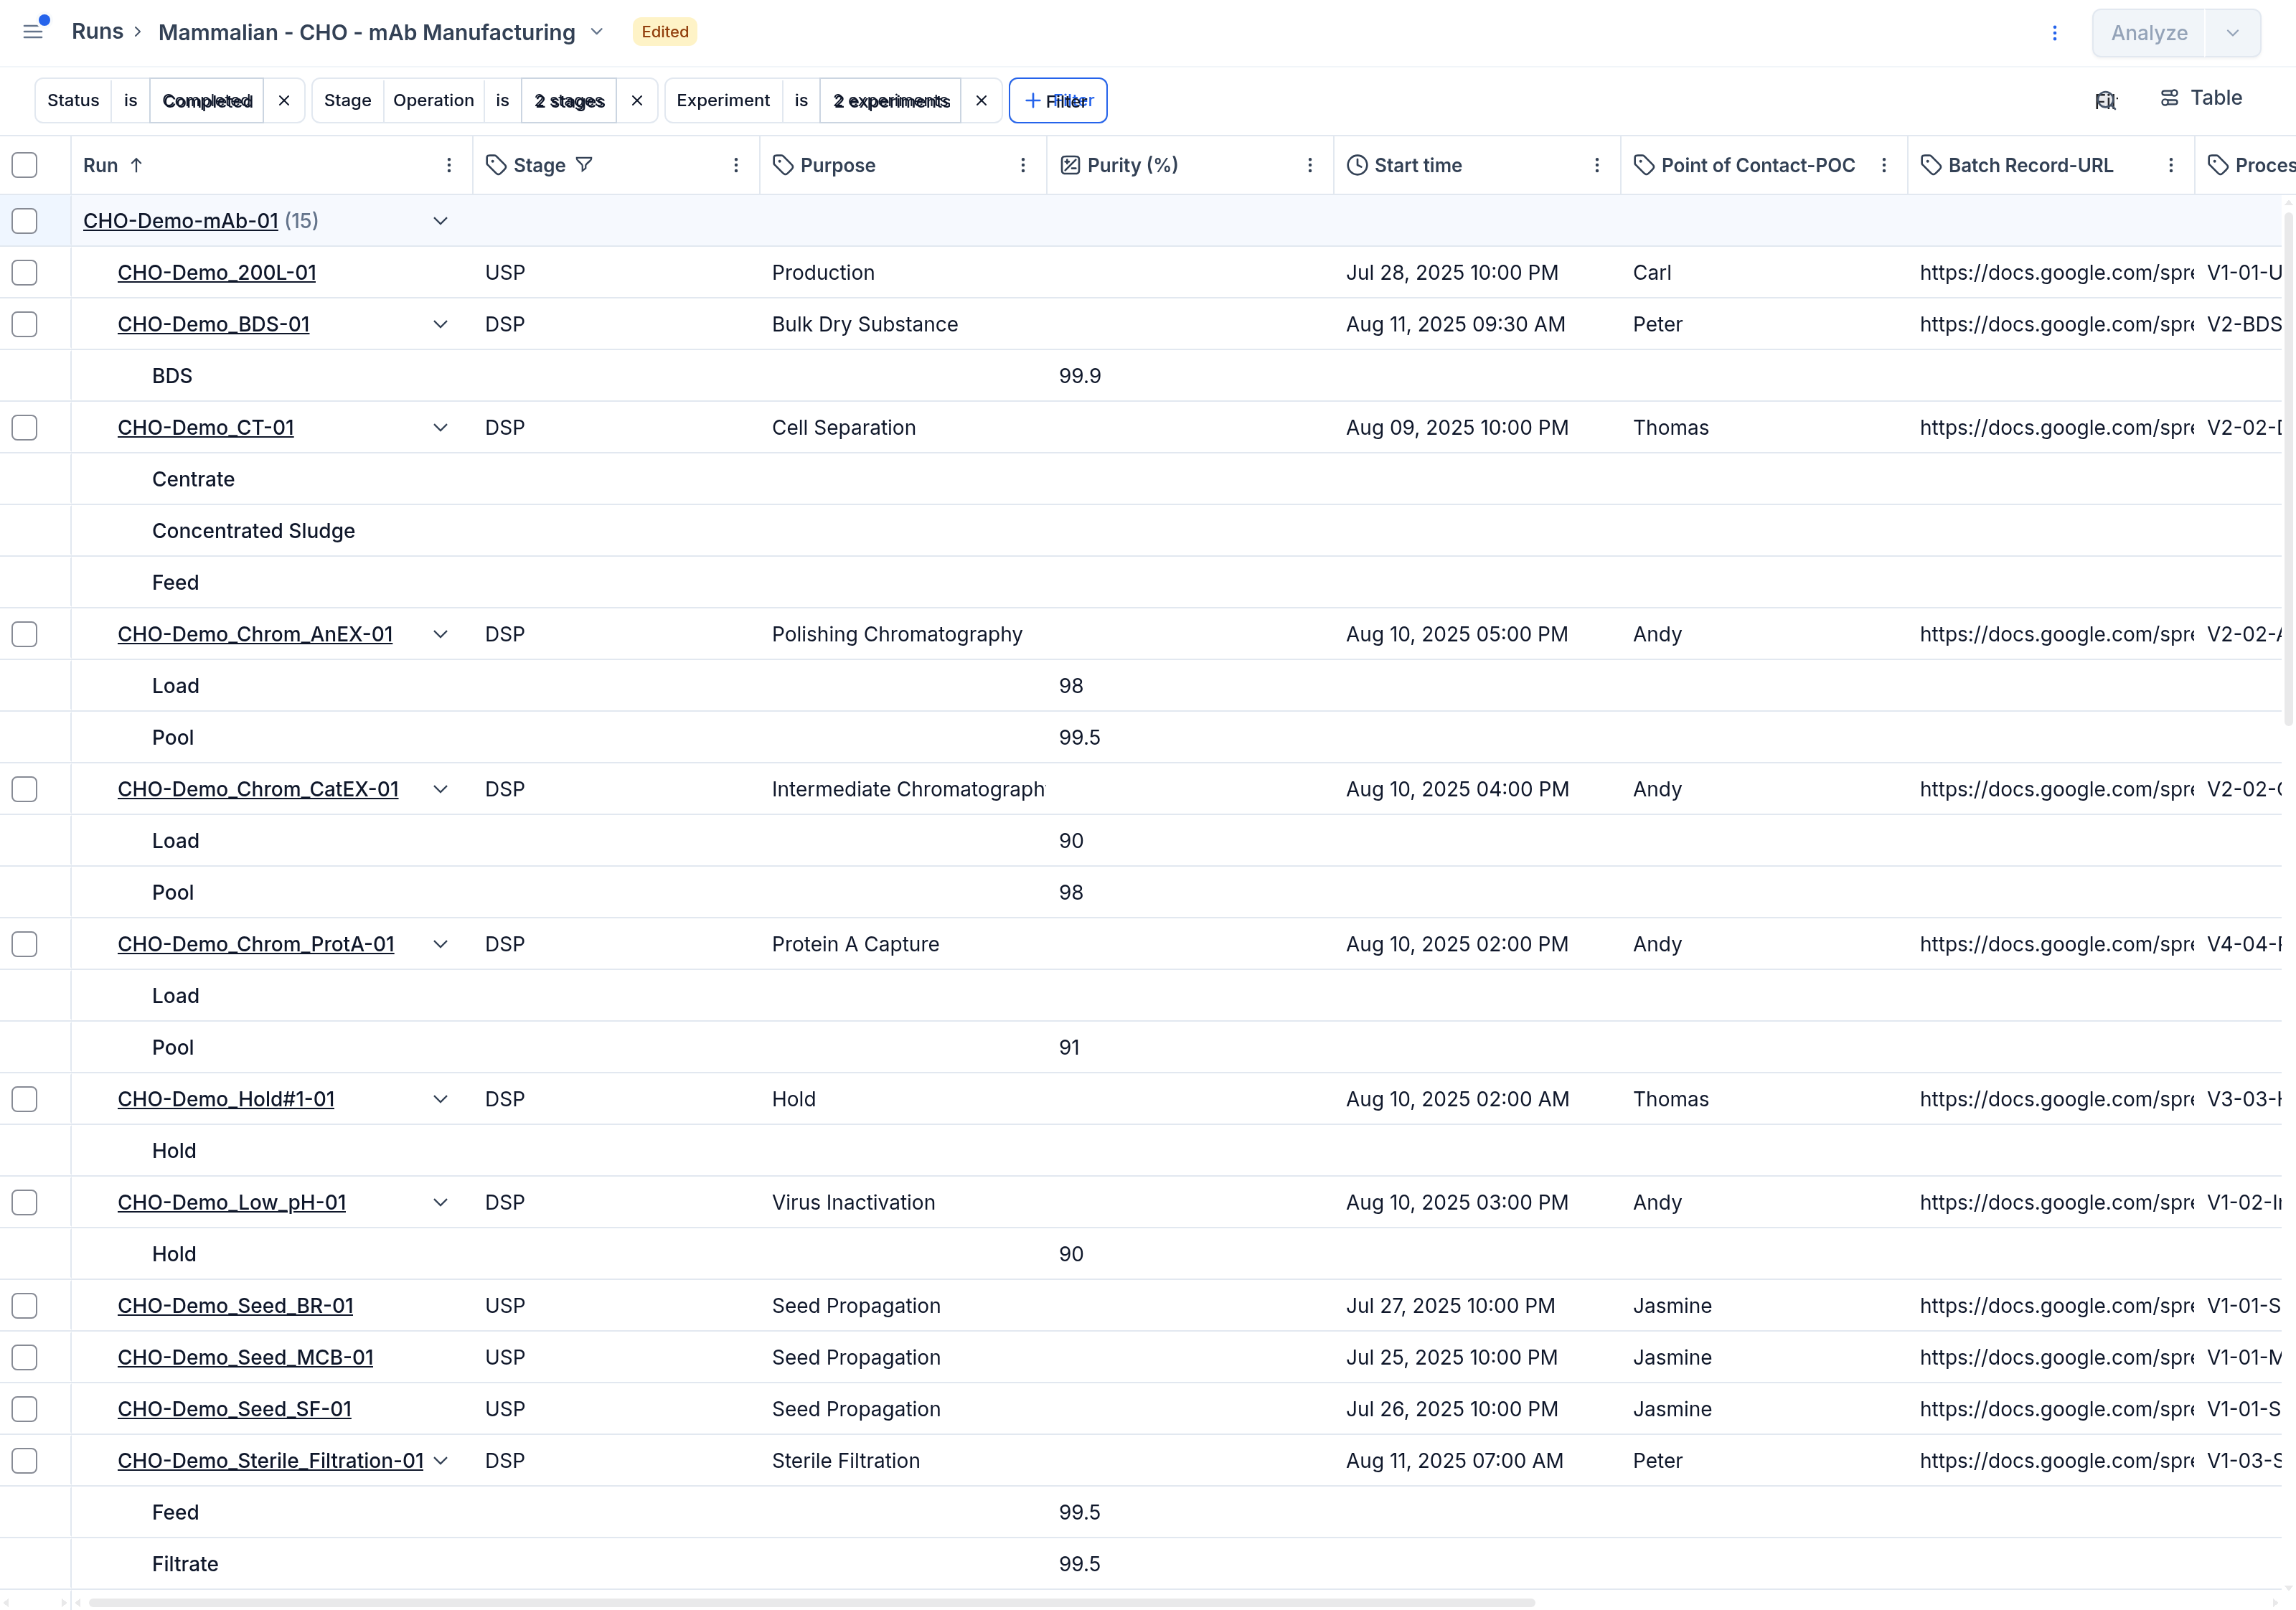
Run table — By Run & Streams
The Runs table adds a pivoted DSP view that lets you switch between By Run and By Run & Streams, so you can compare each unit operation down to its individual material streams in one table. See the Runs guide for the base table experience.
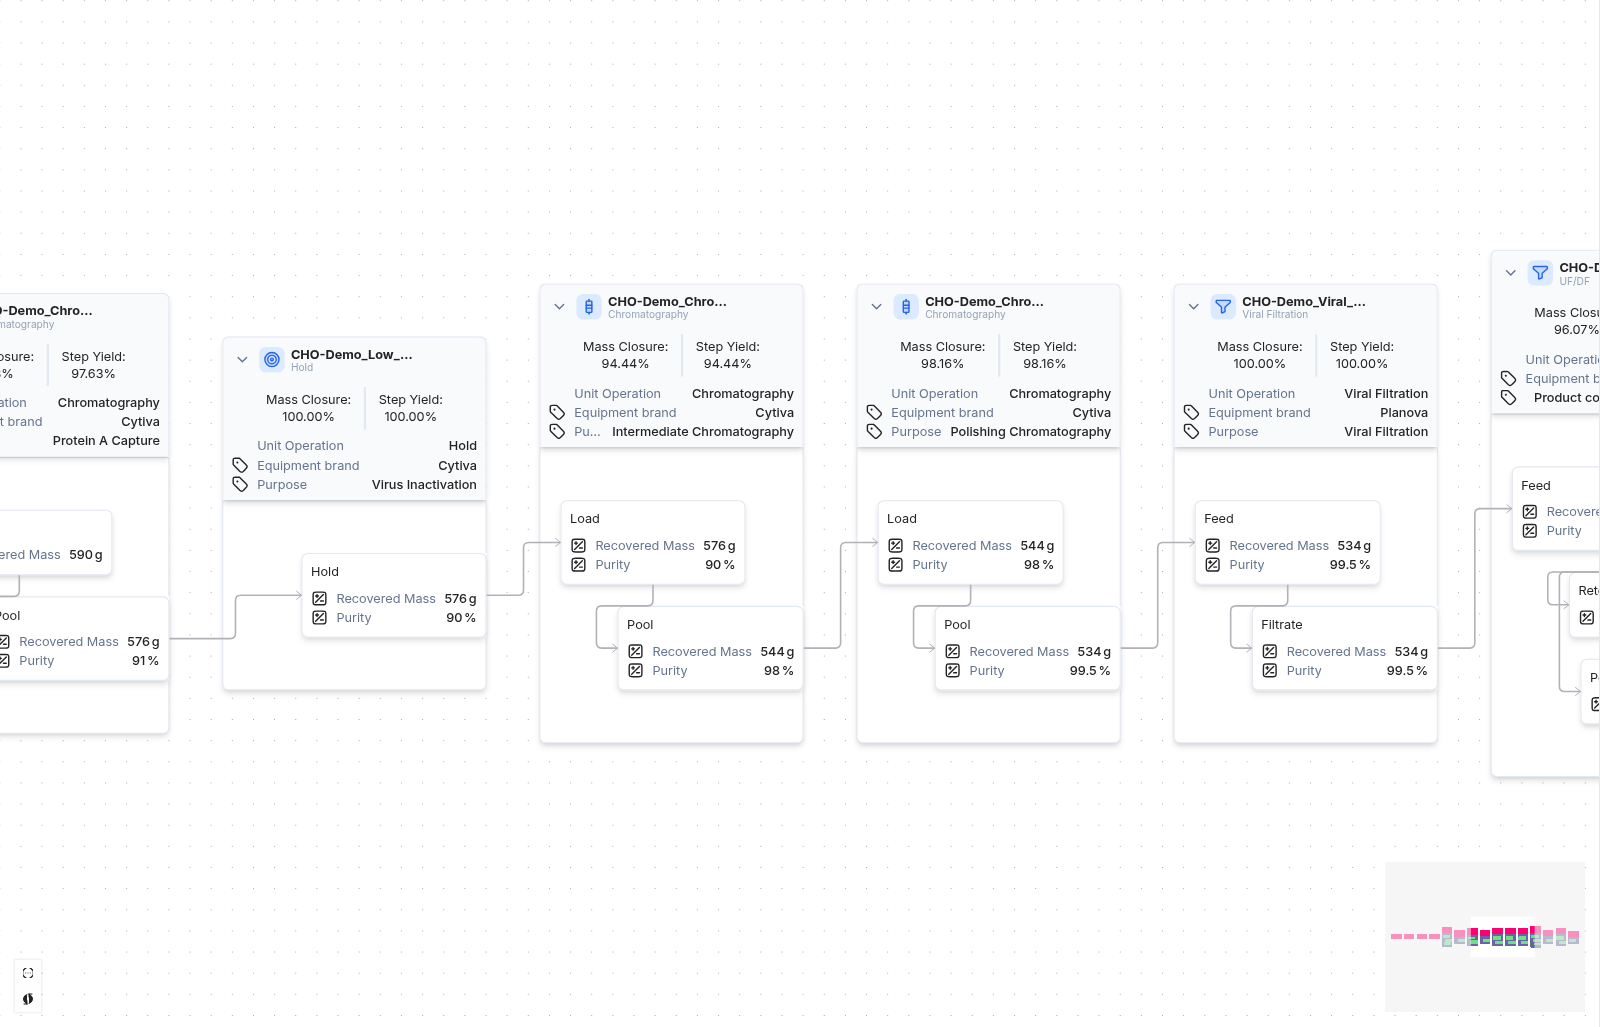
Lineage
The Lineage tab visualises the purification train as a connected flow of unit operations and material streams, with per-step figures such as Mass Closure and Step Yield so you can follow recovery and purity across the process.
You choose which properties and metrics appear on each block from the View panel, and select a mass-balance property such as Recovered Mass to track material recovery step to step. See the enhanced Run Summary Lineage section for the base lineage experience.
Reading mass balance
Each unit operation shows two figures derived from the mass-balance property you select (for example, Recovered Mass), comparing what enters a step with what leaves it:
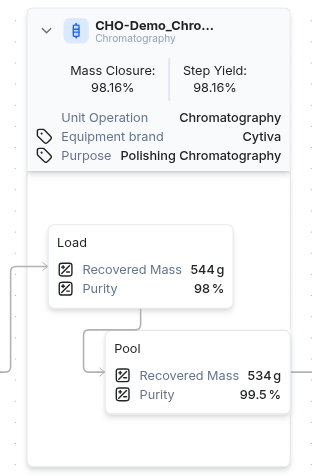
- Step Yield — the proportion of the input recovered in the step's output stream(s), shown as a percentage (output ÷ input). It reflects how much material the step retained.
- Mass Closure — how much of the input is accounted for across both the output and any known waste stream(s), shown as a percentage ((output + known waste) ÷ input). Values near 100% mean the step's material is fully accounted for; a large gap points to unmeasured losses or missing data.
Invert converts stream values to a common basis (including mass-to-molar conversions where a molar mass is defined) before computing these figures, so streams recorded in different units still compare correctly.
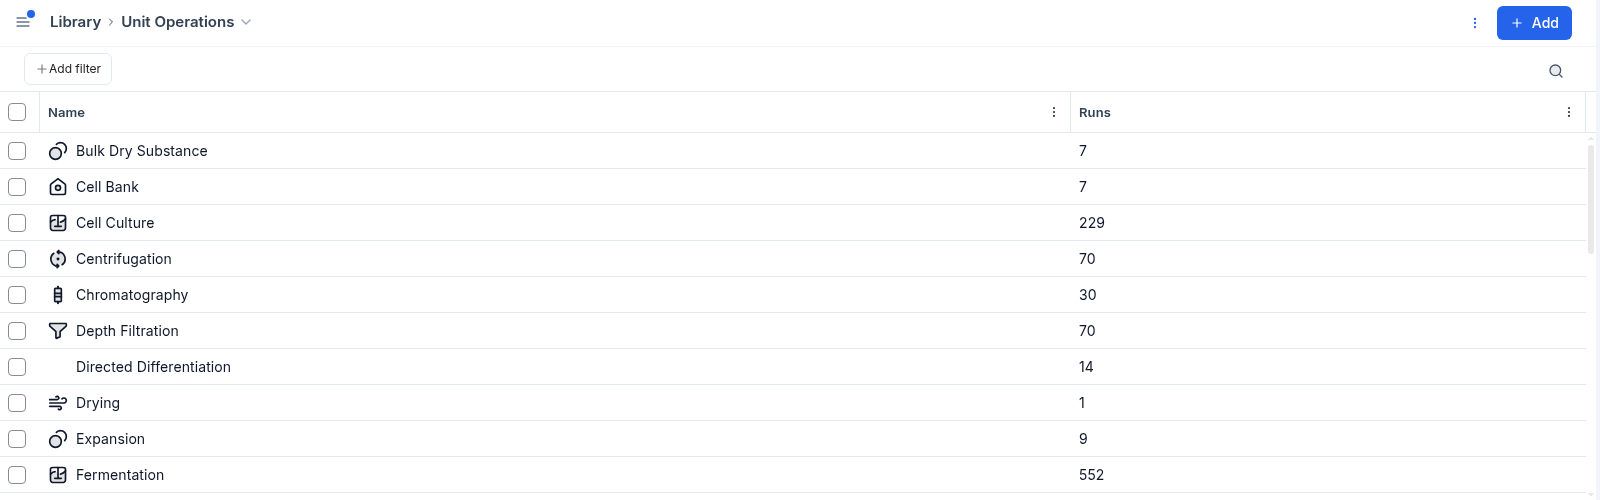
Unit operations in the Library
Downstream processing is built on unit operation types, which you manage on the Unit Operations tab of the Library. Each type carries a Name (e.g. Chromatography, Viral Filtration, Hold), an optional Icon that identifies it across the DSP views, and a Context note describing the step.
From a unit operation type's panel, Show related runs opens the Runs table filtered to that unit operation and Show related reports opens the matching reports. With DSP enabled you can also group the runs table and charts by unit operation, letting you compare the same step across many runs. See the Library guide for managing library entries in general.
Importing DSP data
DSP structure — unit operations, material streams, and the lineage connections between runs — is populated through the same Import flow as the rest of your data, using either the standard Run Data mappings or a custom-built mapping:
- Material streams — a multi-stream Run Data mapping with a Material Stream column lets a single run carry several typed streams (load, pool, feed, filtrate, and so on).
- Unit operations — a Unit Operation column places each run's data under the right step in the train.
- Lineage connections — an Input Run column names each run's upstream source, linking one step's output to the next step's input.
Standard mappings cover the common file shapes; when a source file doesn't fit, a custom mapping can be built to the same effect. See the Import guide for the ingestion workflow.
Plotting line charts against a non-time x-axis
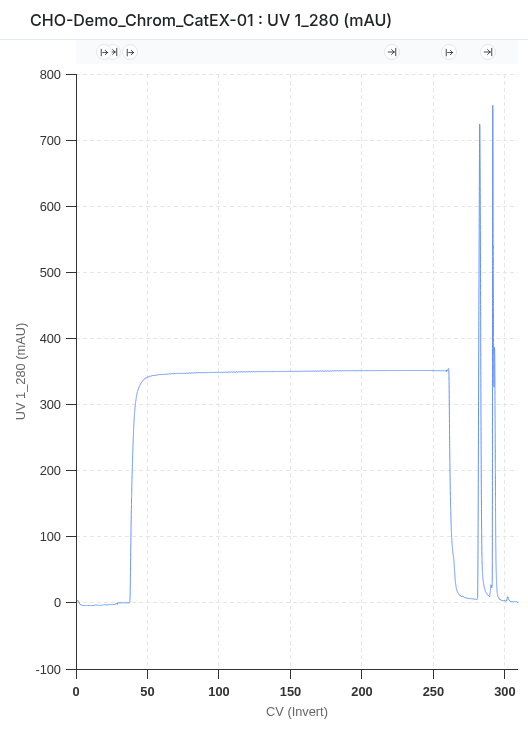
By default, line charts on the Analysis page plot values against time. With DSP enabled you can set a metric or property as the x-axis instead, plotting one variable directly against another rather than against elapsed time. You choose the x-axis from the chart's axis controls; for non-DSP organizations, line charts remain time-based.
Where DSP fits in the rest of Invert
The DSP views described above are extensions of the core Invert pages rather than separate tools — the same runs, run details, and library definitions you already use, with an added downstream-processing layer. These guides cover the standard experience each DSP view builds on:
- Runs — the runs table and how to filter, group, and lay it out. DSP adds the By Run & Streams pivot to this same table.
- Run Summary — a single run's detail tabs, including the standard Lineage flow. DSP enriches that Lineage with unit operations, material streams, and per-step recovery figures.
- Library — where unit operation types, metrics, and properties are defined. The unit operations and stream properties shown in the DSP views come from these definitions.
Getting downstream processing
Downstream processing is an add-on that is enabled per organization. If your organization doesn't yet have DSP and you'd like access to the views described here, or you have questions about setting it up, contact us at support@invertbio.com.