Get Started
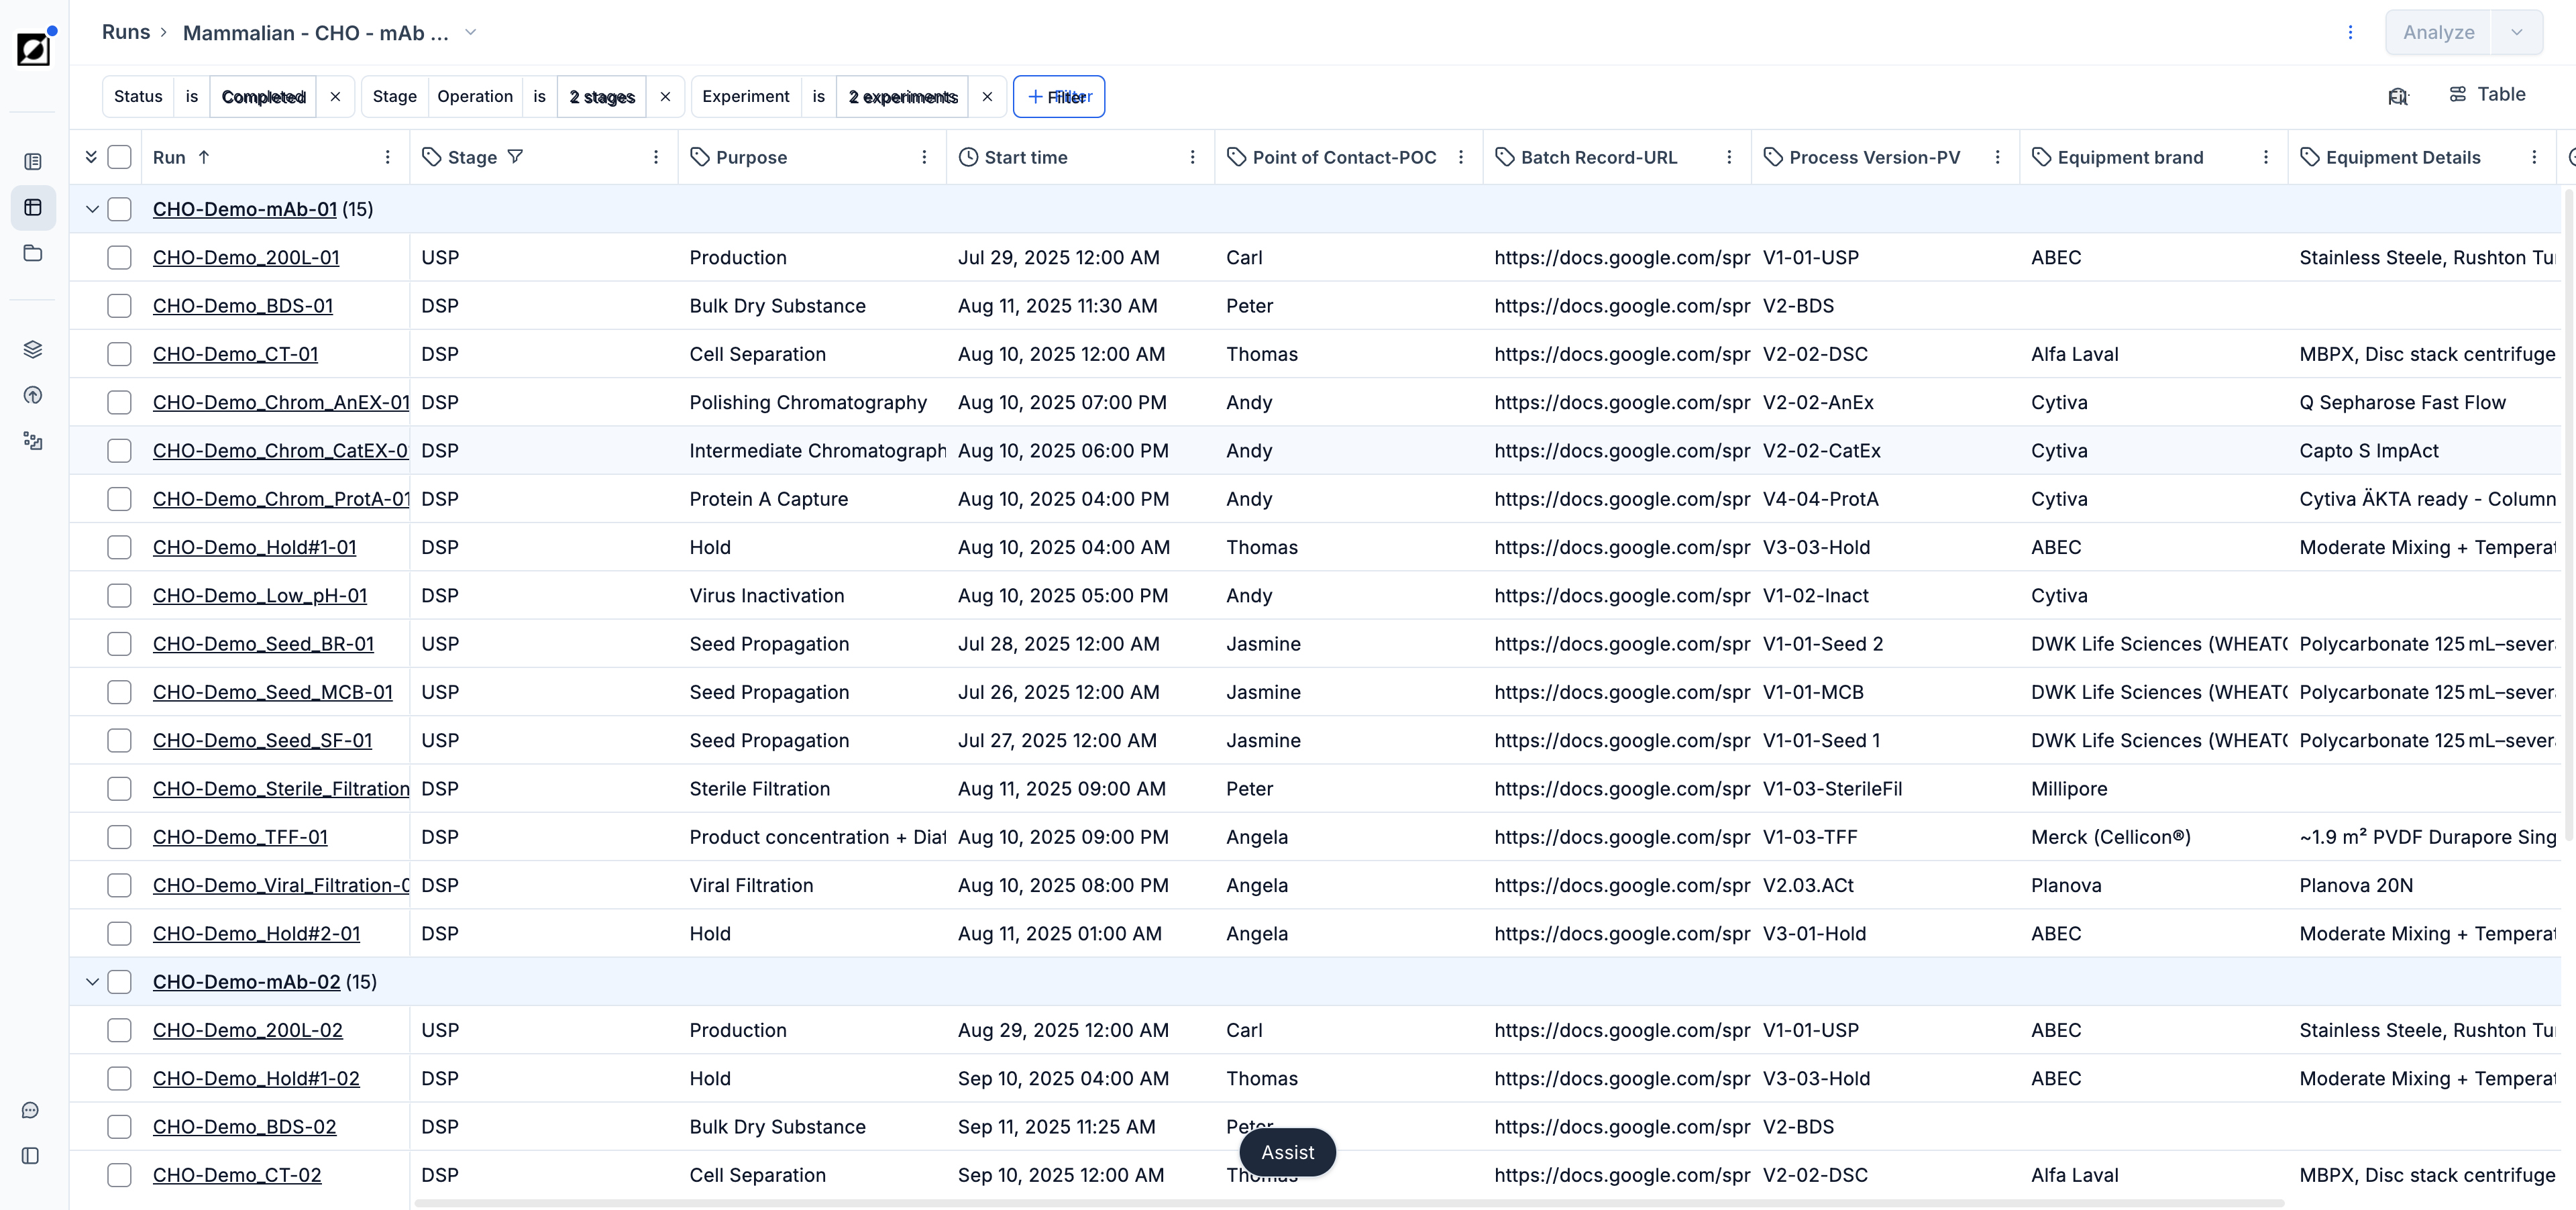
Begin by exploring your runs in the run directory. Use the filtering option to tailor your view to include relevant runs for your analysis. Customize the layout by adding or removing columns. Select runs for bulk editing or timeseries analysis.
Key Features
-
Filtering: Narrow down your view by applying filters based on different attributes like experiment, organism type, or any other relevant metadata associated with your runs.
-
Sort: Sort your runs alphabetically in ascending or descending order depending on your needs. Click on the arrow down icon inside any of the column headers and select 'Sort A to Z' or 'Sort Z to A'.
-
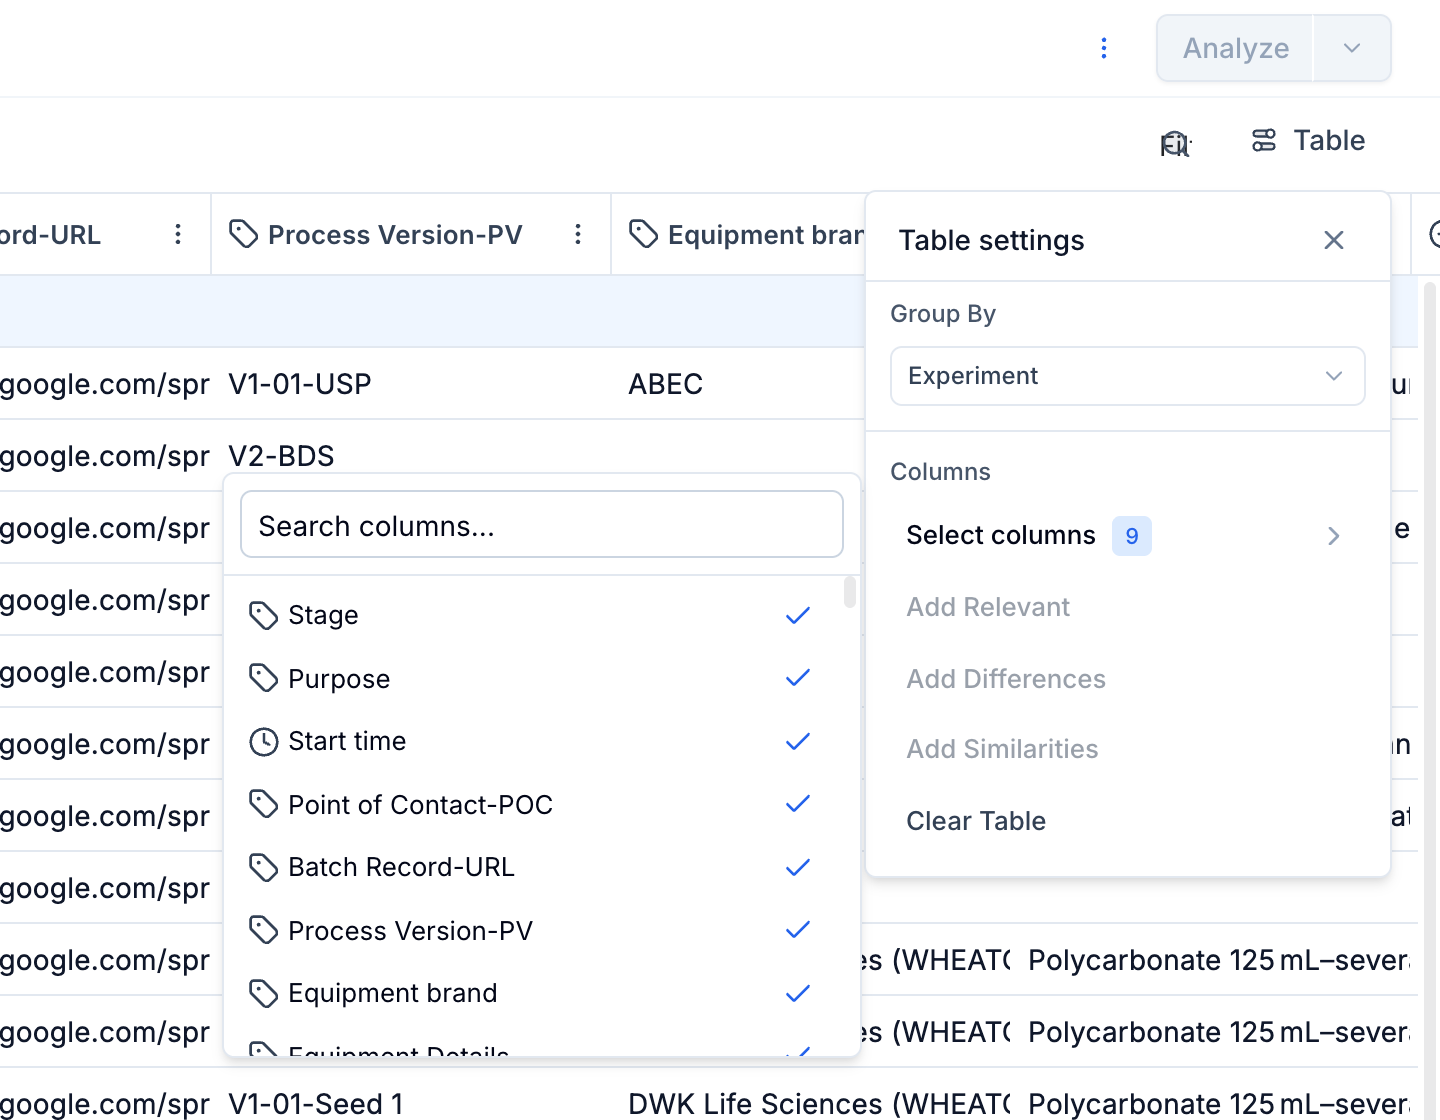
Grouping: Group your runs by specific criteria for a clearer overview. Choose from options like operator, site, strain, or any other run property from the list. Bulk select grouped runs by clicking the checkbox next to the group label.
-
Table Layout: Tailor your run directory view by adding or removing columns. Change the column order by dragging-and-dropping. Take advantage of the 'Add Similarities'/'Add differences' feature to quickly compare run data across highlighted runs. DSP-enabled organizations also get a By Run & Streams view for comparing each unit operation with its material streams; see the Downstream Processing guide.
-
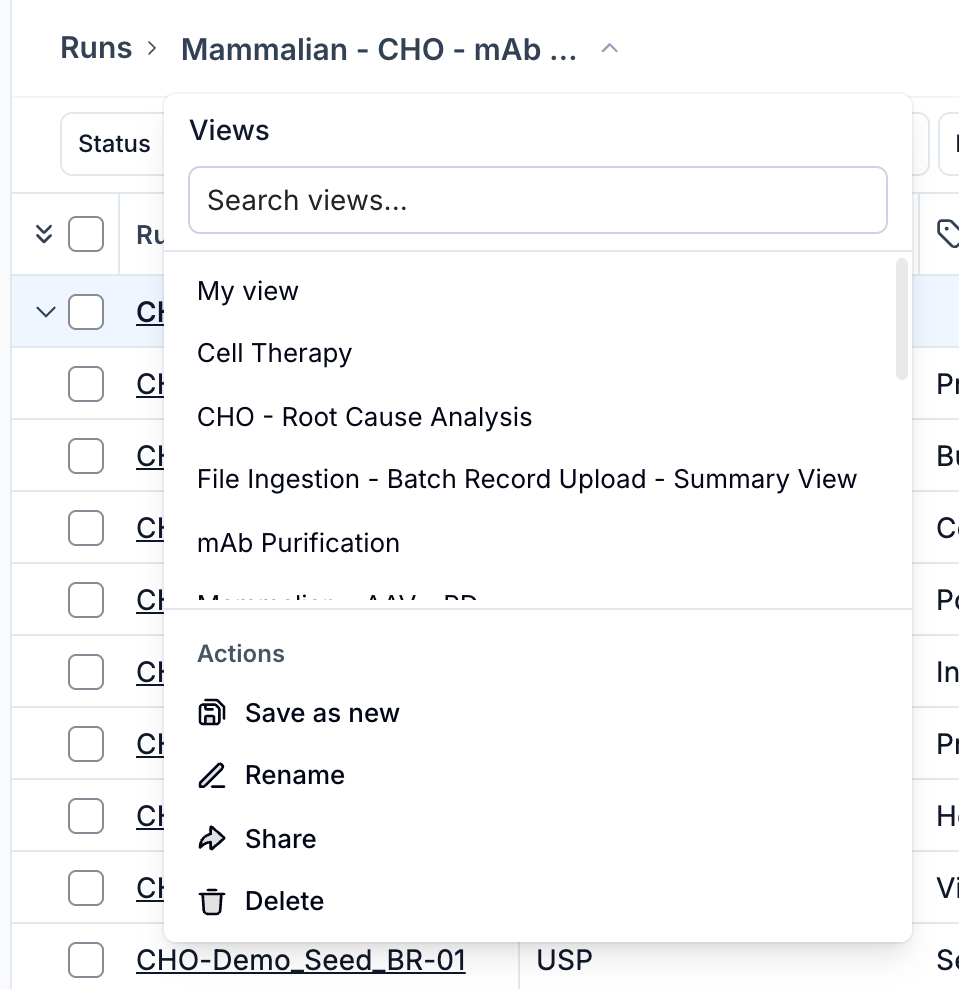
Saved Views: Save your run directory configuration for a more streamlined and reproducible data analysis experience. Apply filter settings and adjust the table layout followed by pressing 'Save'. Select a view from the dropdown to restore a previously built configuration. Views can be shared with teammates via the 'Share' option in the view dropdown, which copies a direct URL to the current view.
-
Aggregations and Units: Choose between a variety of aggregation settings for timeseries metrics (e.g. Mean, Last, Maximum, Minimum, etc.). Use the built-in unit conversion tool to quickly change between available unit options (e.g. mL/min to L/h).
-
Search: Use the search feature to quickly identify relevant runs in the current run directory view. Search for run names or any other metric entry, like NH4OH or Process development.
-
Experiment planning: Take advantage of the 'Status' property to organize runs by its status. Use the 'Status' filter and select 'Completed', 'In-progress', 'Scheduled' or any of the other options to further customize your view.
-
Quick access to Summary page: Runs and Experiments are clickable entities, allowing you to quickly access the associated Summary page for detailed information related to a particular entry.
-
Editing: Select a run and make edits to its associated metadata. Use our bulk editing feature to streamline editing across multiple runs simultaneously. Use shift-click feature for quickly highlighting multiple cells.
-
Run merging: To merge two or more runs into a single run, select the relevant runs and click the 'merge' button accessible through the dropdown menu in top right corner. Choose the run to keep and proceed with the run merge.
-
Export: Select one or more runs and click 'Export' to open the Full Data Export page. Choose which timeseries metrics and run metadata columns to include, then download a structured Excel file containing all selected data.
-
Transfer to Analysis: Choose a specific run or a selection of runs to carry forward to the Analysis page. This allows you to create line, scatter, or bar charts based on the selected data for deeper insights and visualization. You have the option to save the analysis as a sharable report.