Navigation
To access the Run Summary page, double-click on a run in the run data table on the Runs page. This will open the Run Details page. Available tabs are: Summary (when enabled), Properties, Metrics, Lineage, Events, Alerts, and Import History.
Summary
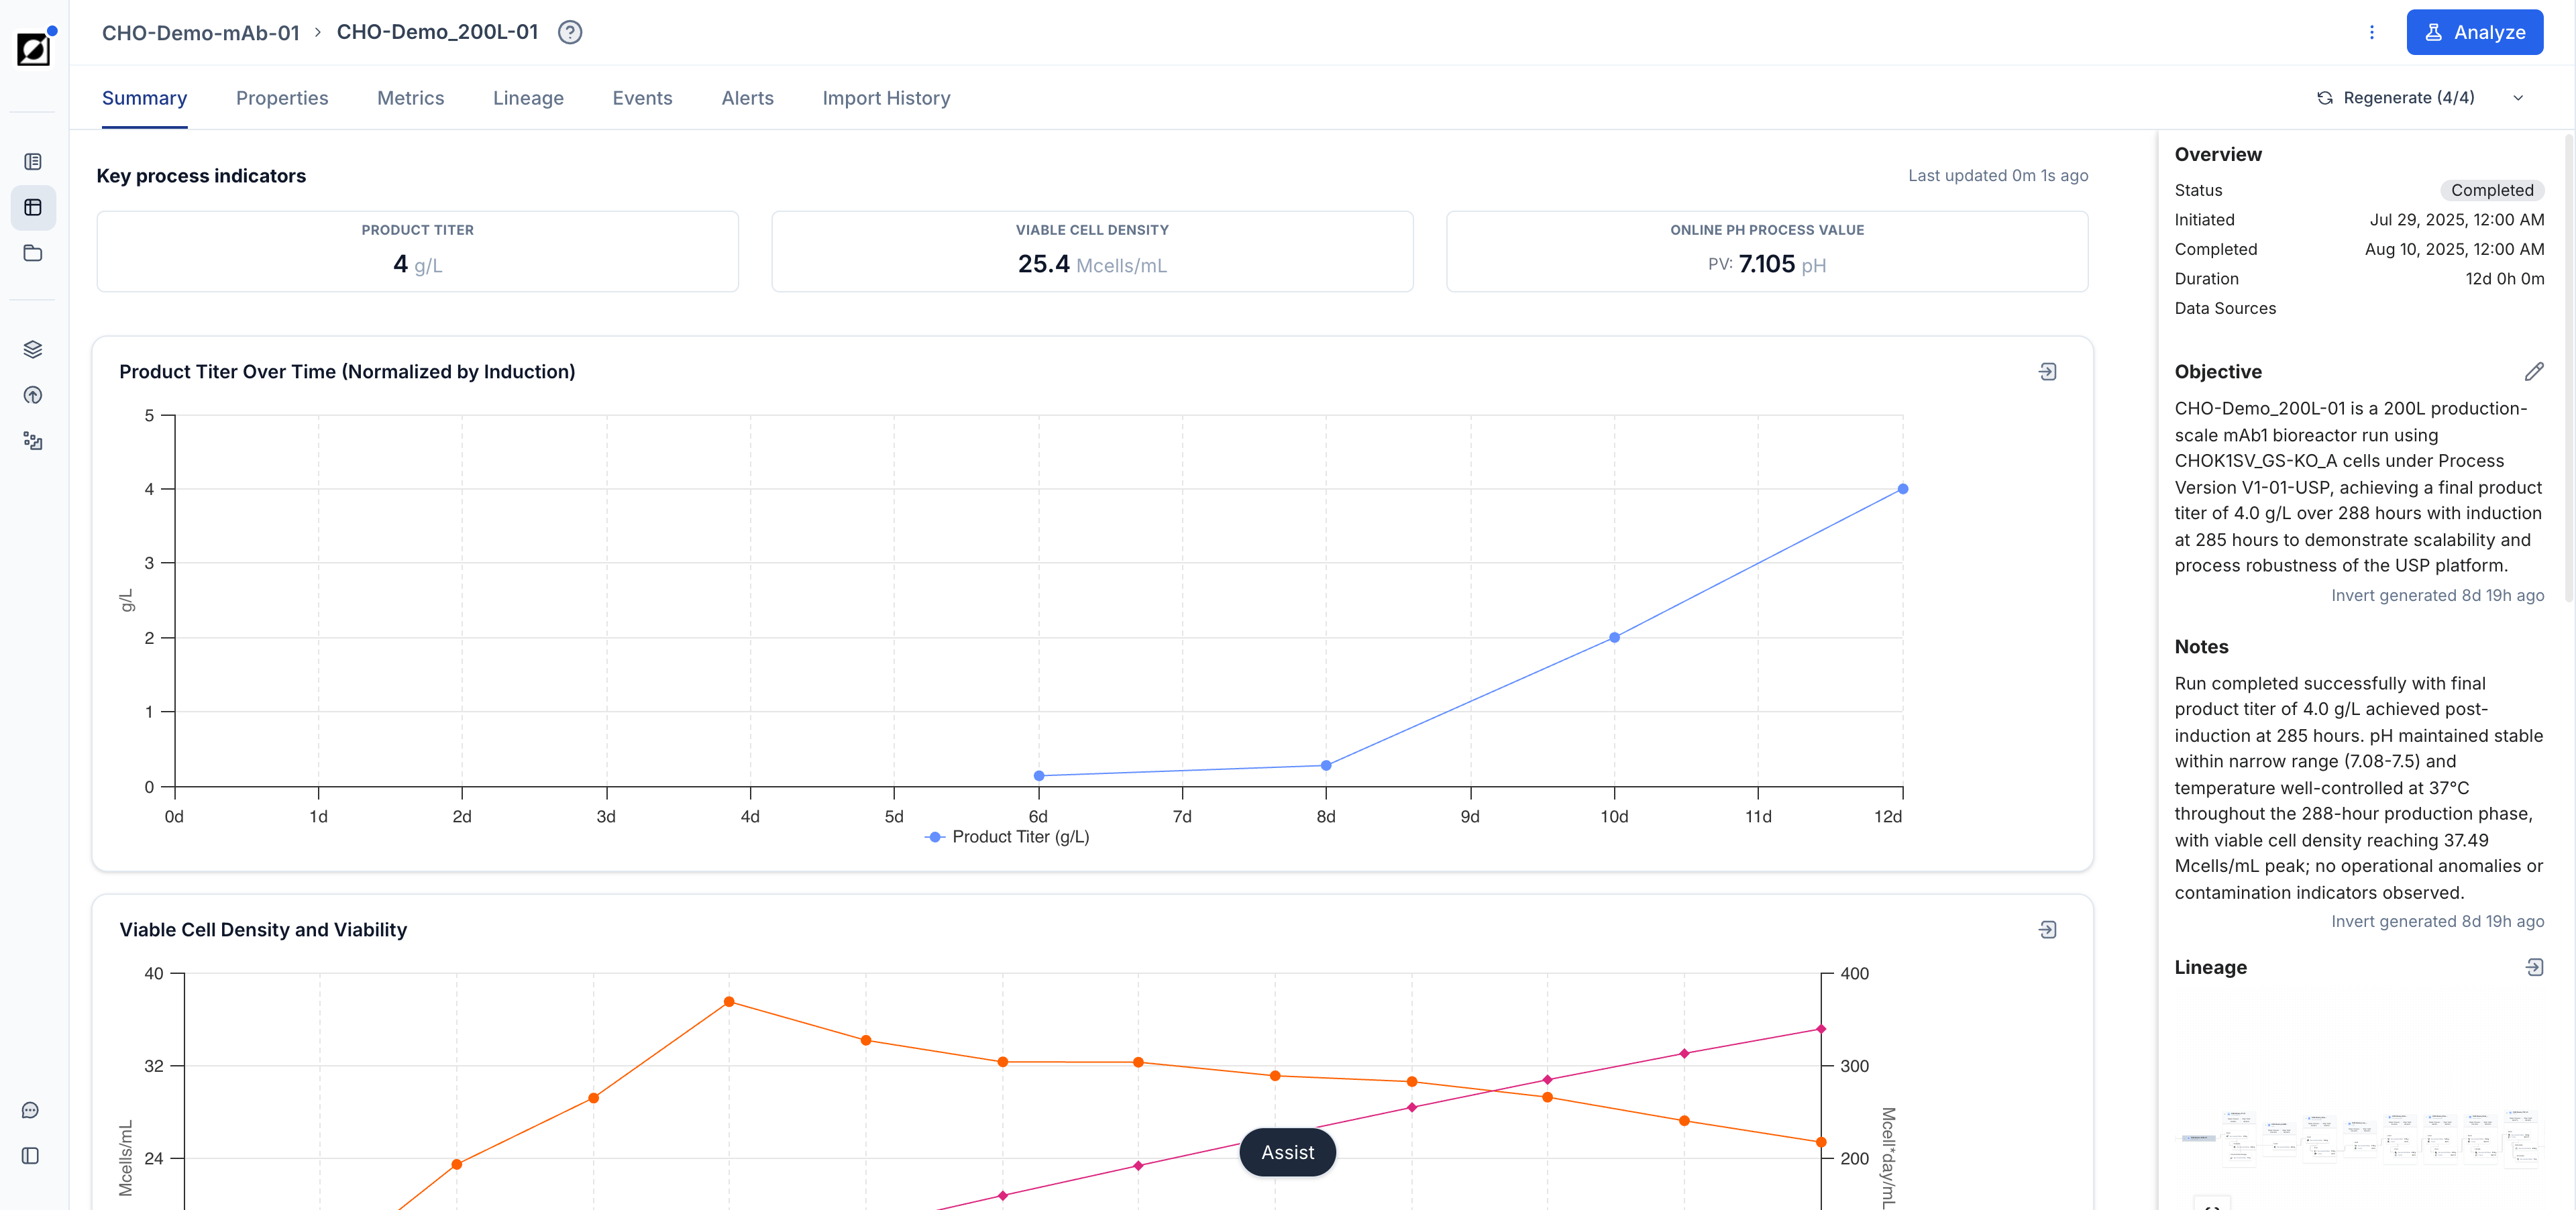
The Summary tab provides an AI-generated overview of the run in a structured dashboard format. It is available for organizations with the AI-generated summaries feature enabled. The dashboard is composed of several sections:
- Key Indicators: A curated set of the most relevant metric aggregations (e.g., final titer, peak biomass, mean pH) displayed as cards for at-a-glance review.
- Graphs: Pre-configured line charts showing key timeseries profiles for the run, such as growth curves, feed profiles, or DO/pH trends.
- Objectives & Notes: A text section capturing the run's objectives and any analytical notes.
- Events: A timeline of annotated events associated with the run.
- Lineage: A visual summary of the run's upstream and downstream material stream relationships.
The Summary tab respects run-specific configuration when available, otherwise using organization-level defaults. Click 'Analyze' on any graph in the Summary tab to jump directly to the Analysis page with that chart pre-loaded.
Properties
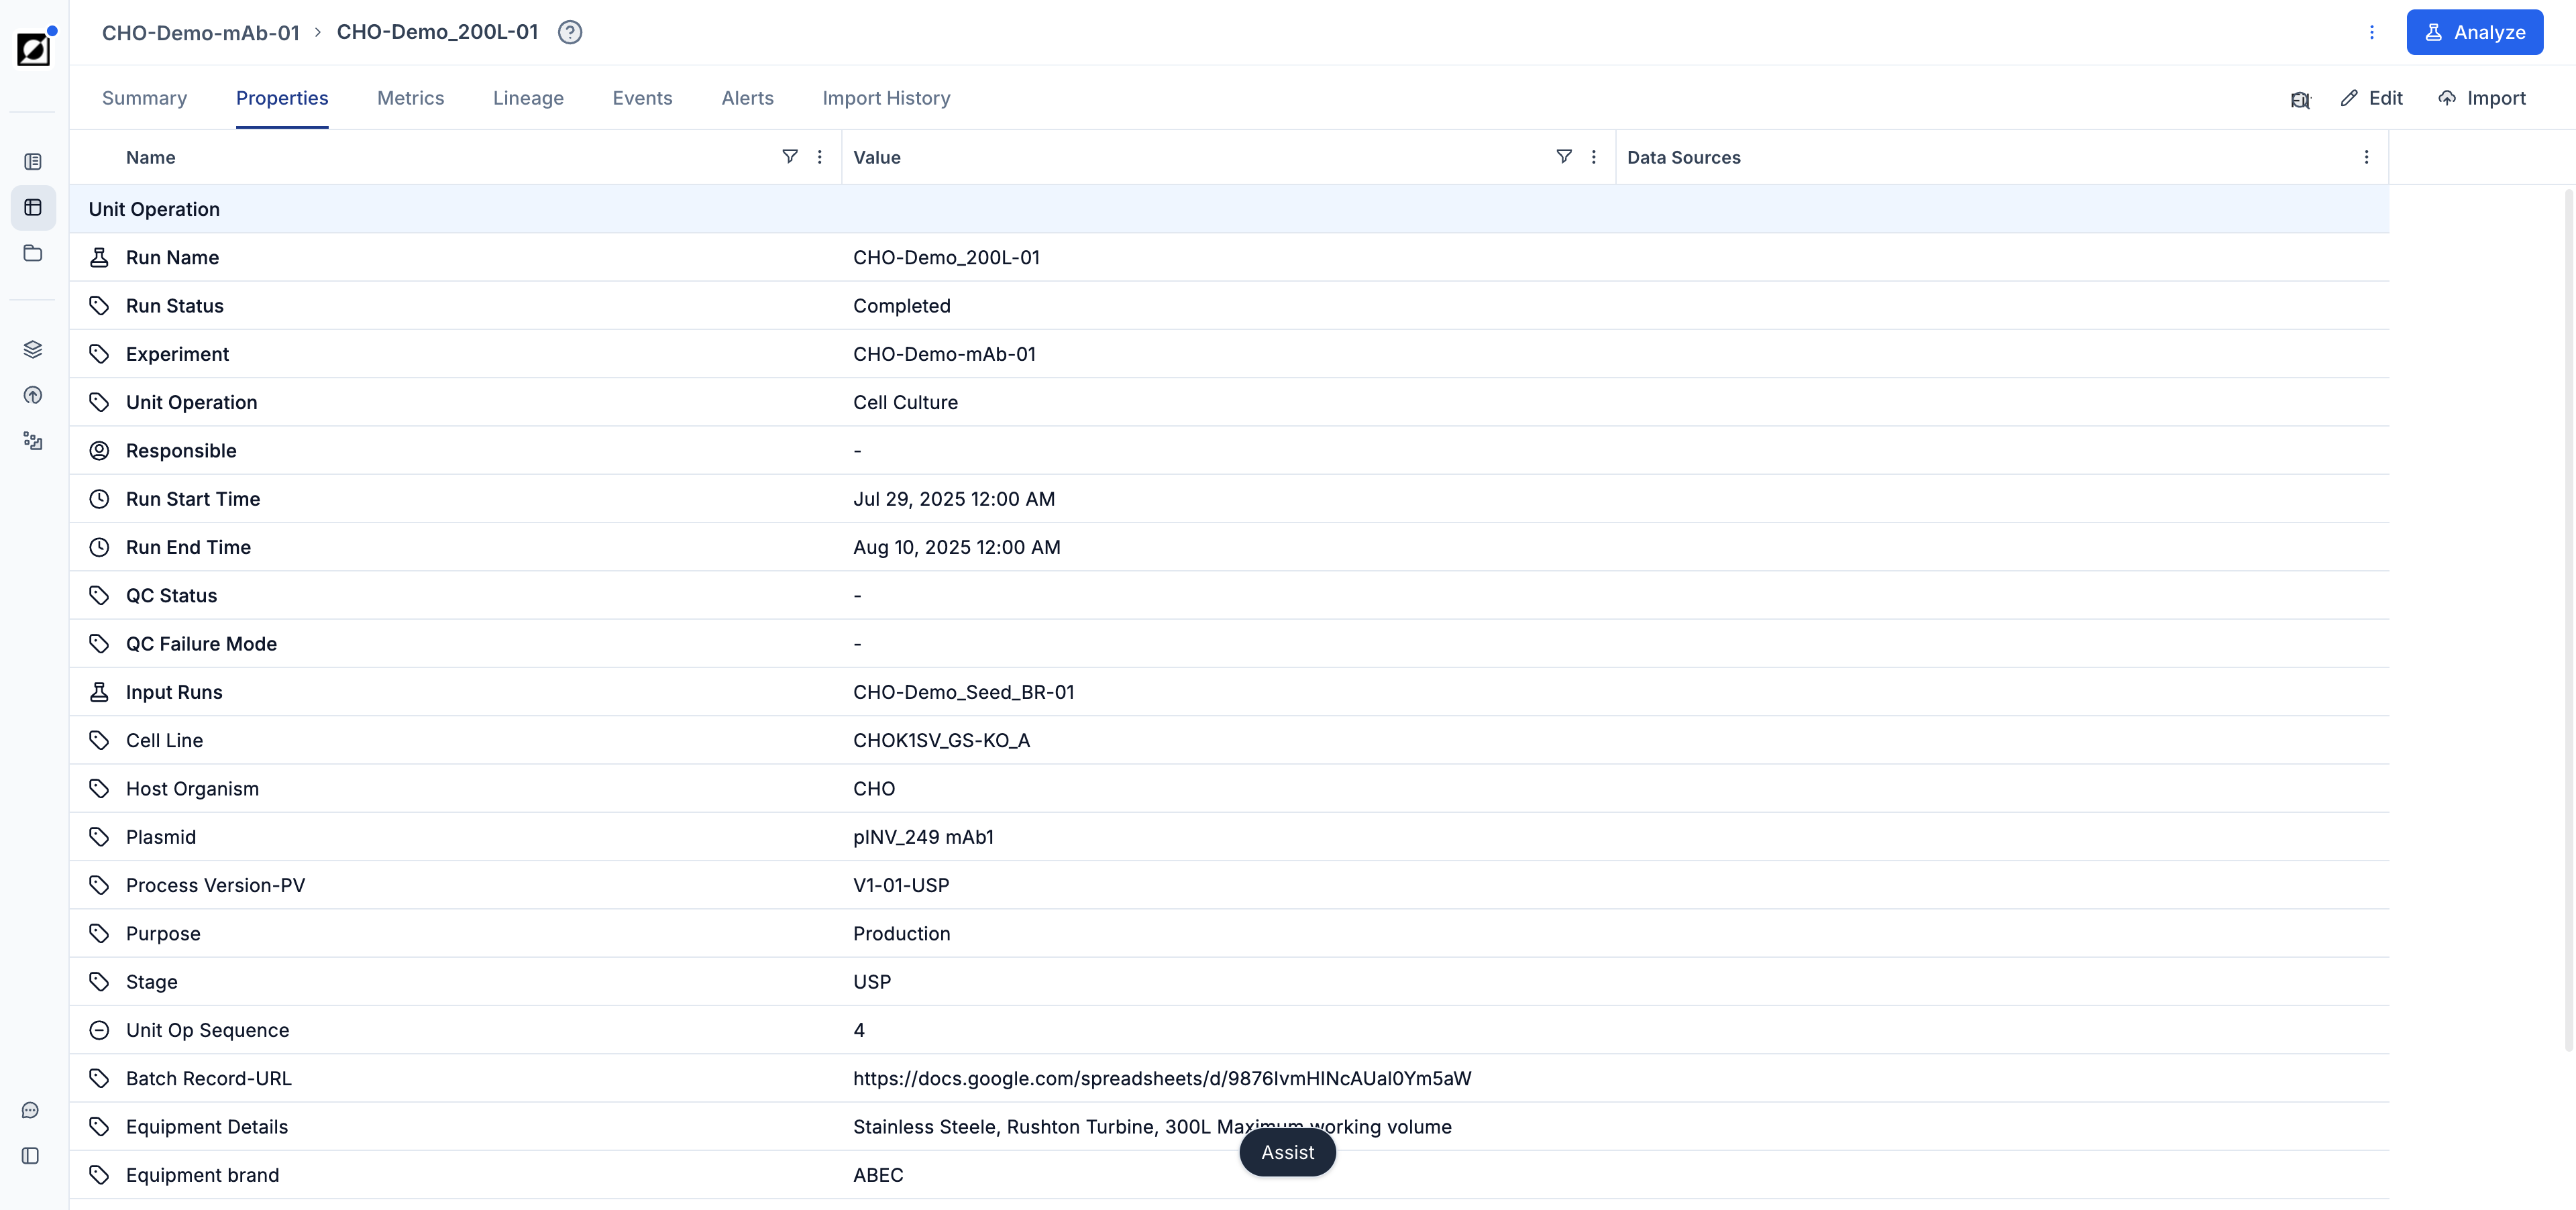
The Properties tab presents a list of the run meta data, including Run Start, Run End, and any other custom property that was previously associated with the run through file ingestion or manual editing. Navigate to the 'Edit' page to switch to the editing view for run archiving and property editing. Data Sources labels provide insights into the origin of a property. Labels are automatically generated upon ingestion.
Metrics
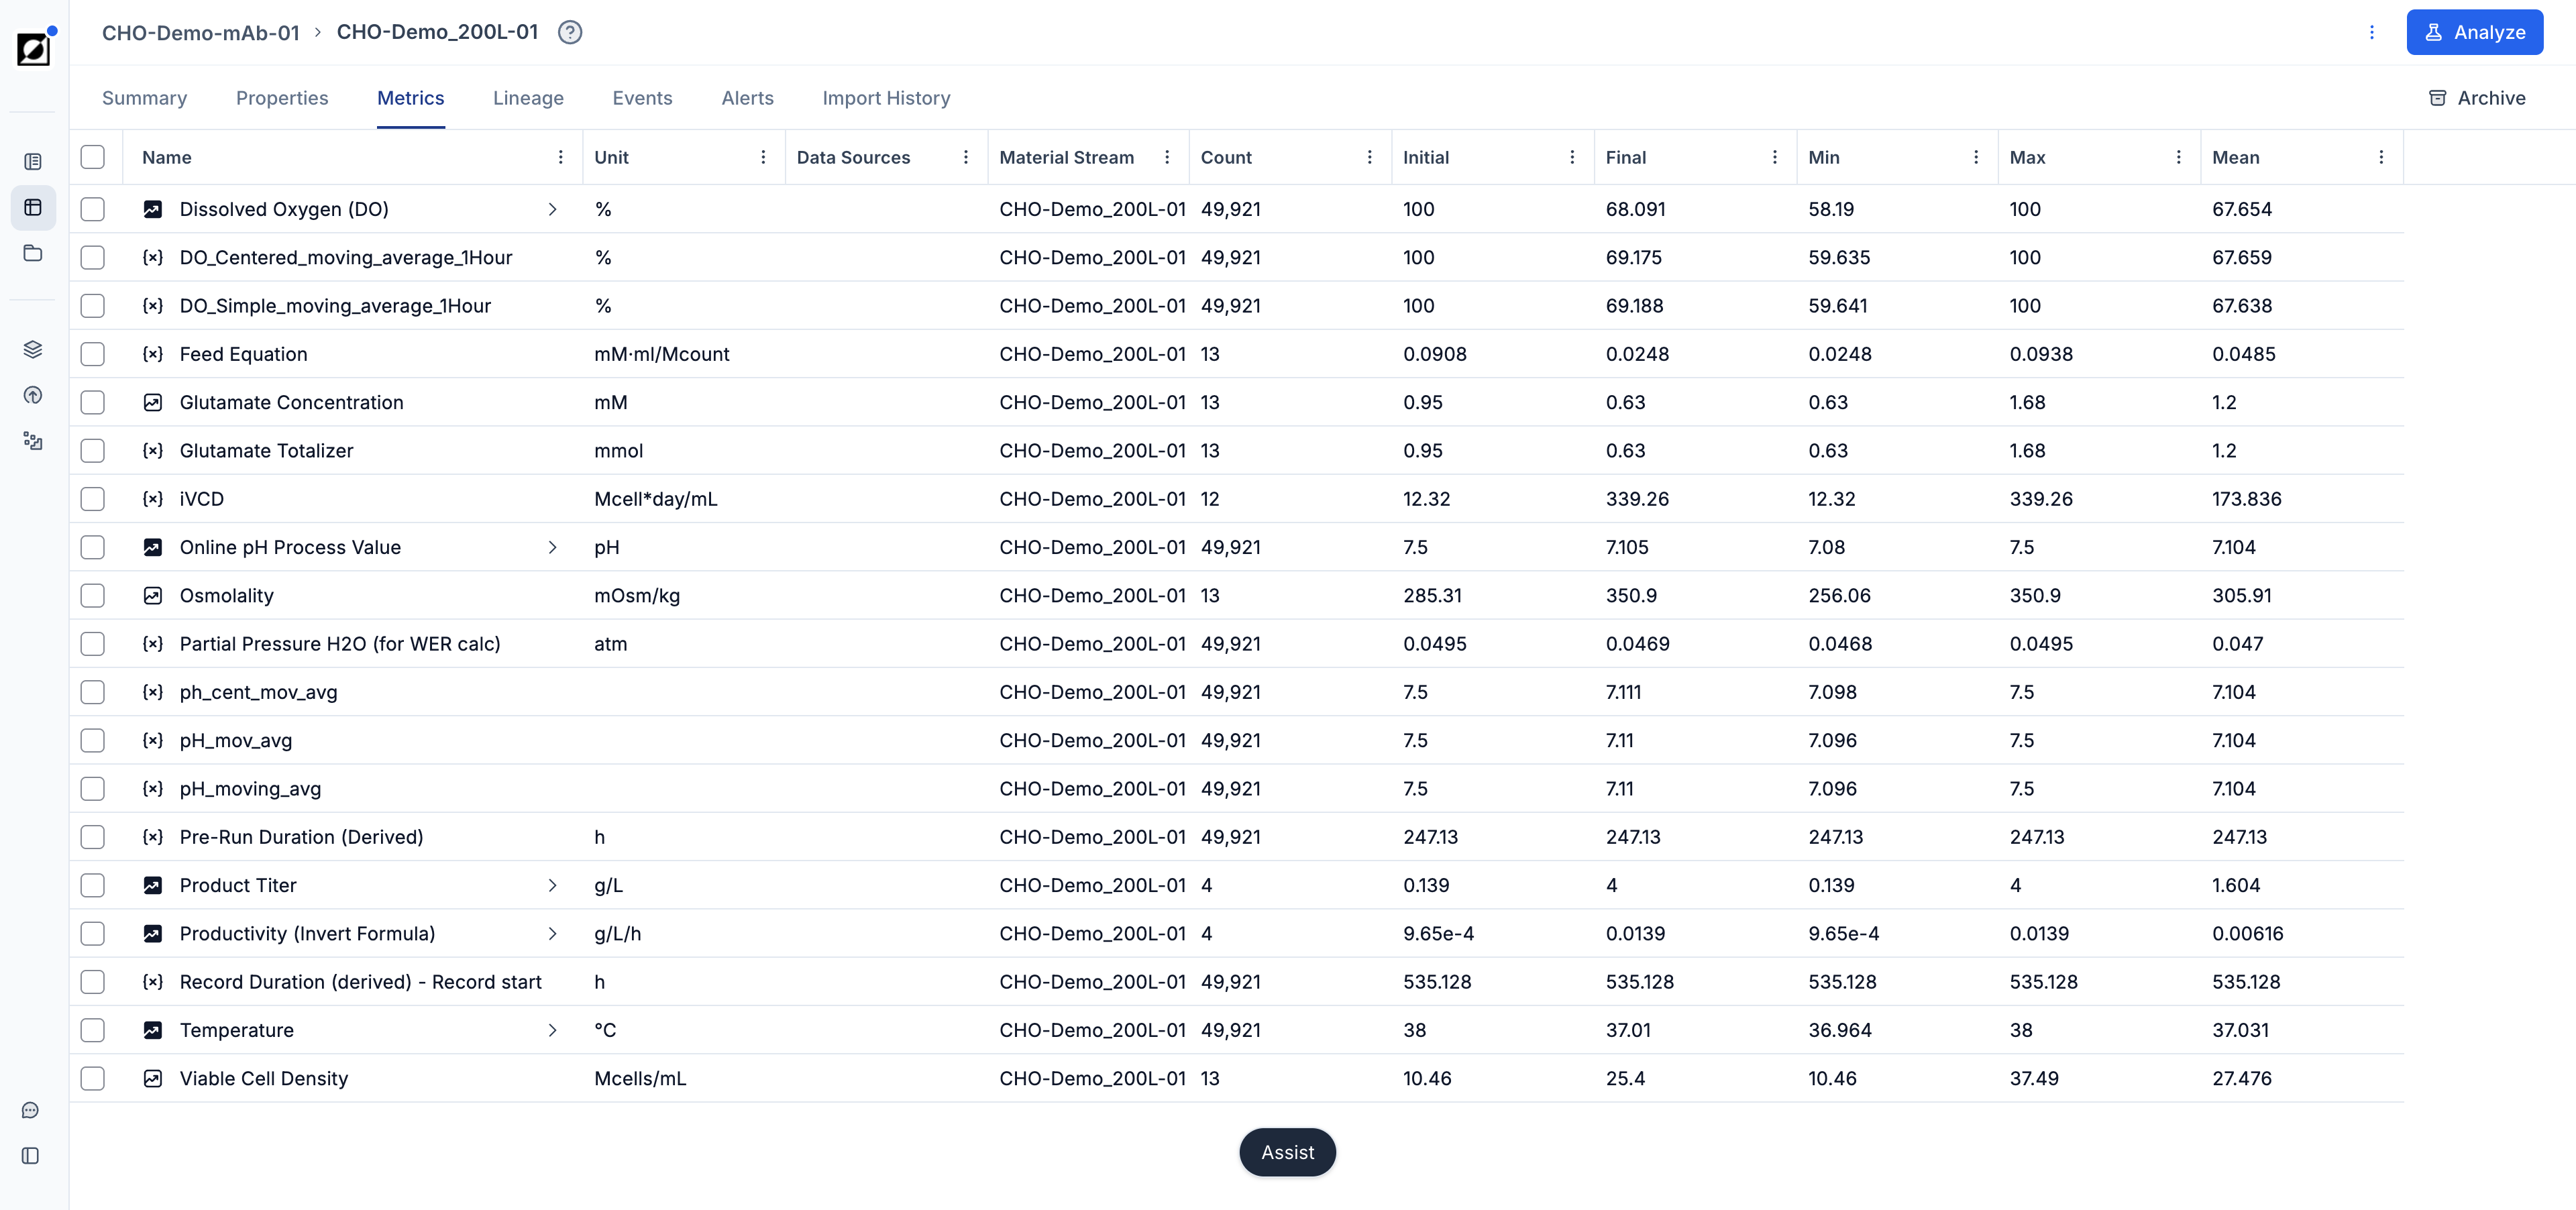
In the Metrics tab, users can access an overview of the time series data associated with a given run. This tab displays a list of time series metrics and formulas, along with useful aggregations and metric units for easy reference. Metrics are categorized into parent and sub-metrics, allowing users to quickly understand the structure and relationships of the data (See 'Library' Article for more details). From this view, users can navigate directly to the metric details page for more information or archive a specific metric from the run without removing it from the overall metric library. This feature provides a centralized place for exploring and managing time series data efficiently. Data Sources labels provide insights into the origin of a metric. Labels are automatically generated upon ingestion.
Lineage
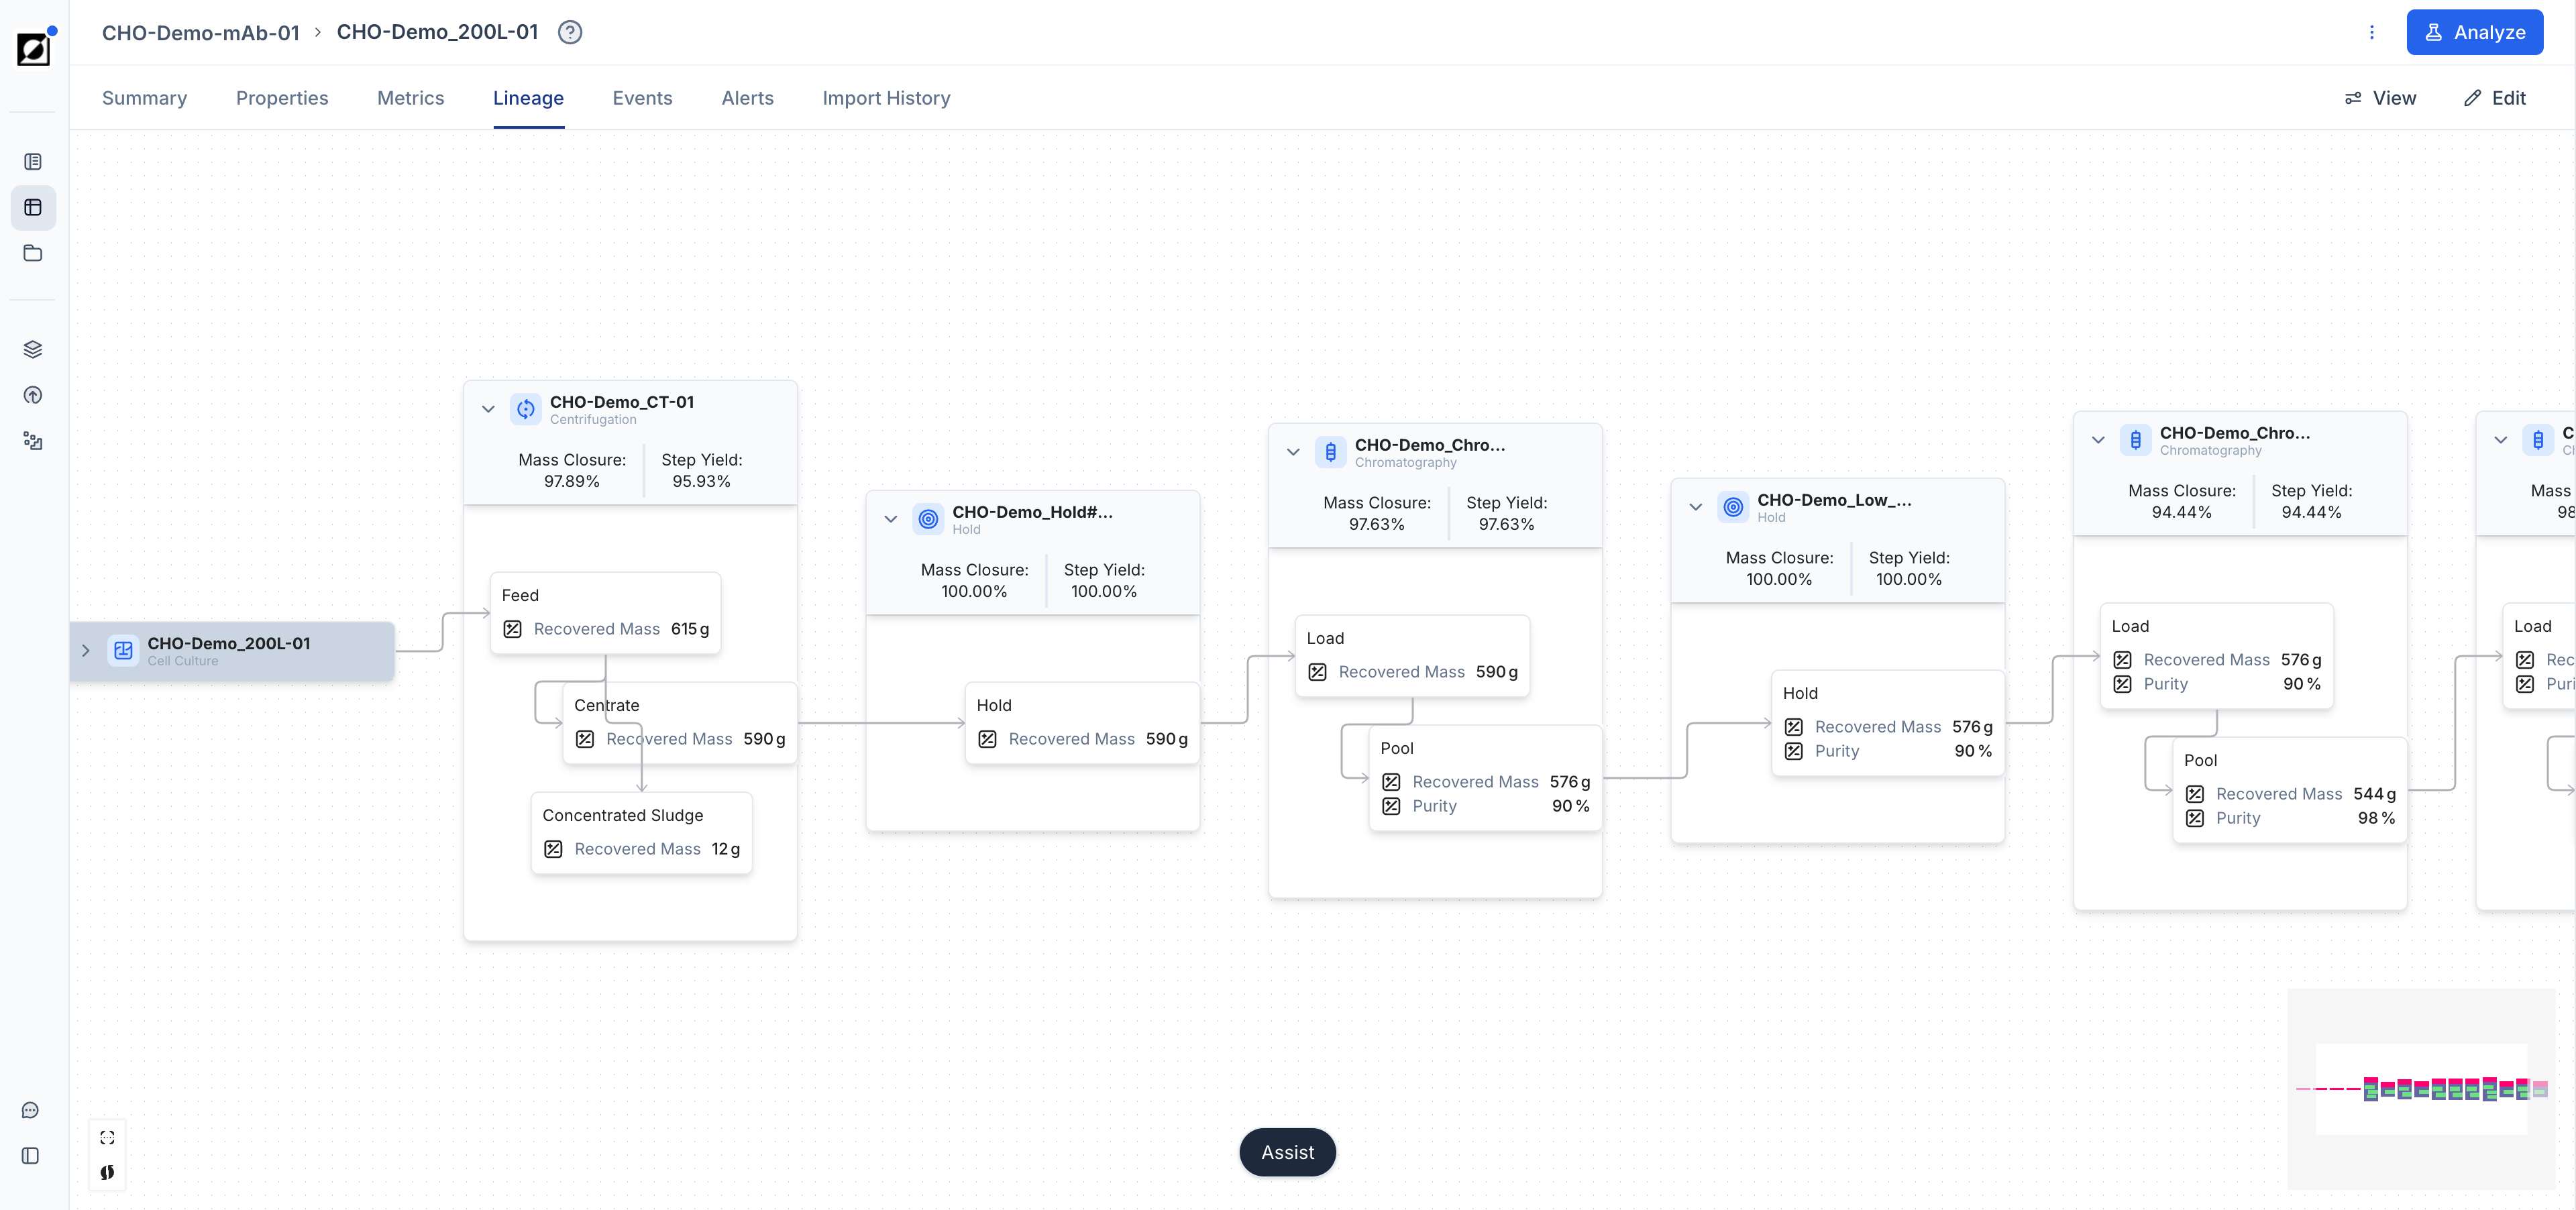
In the Lineage tab, users can access the process flow diagram that tracks the relationships between individual runs. This functionality is particularly useful for understanding the lineage of a run, such as identifying which seed flask was used to inoculate a certain bioreactor or tracing the bioreactor run used for downstream processing testing. To use this feature, enter a valid run name into the 'Input Run' property and navigate to the Lineage tab. Click 'Add property' to provide additional context to the blocks. Organizations with downstream processing enabled see an enhanced lineage view for unit operations and material streams; see the Downstream Processing guide.
Events
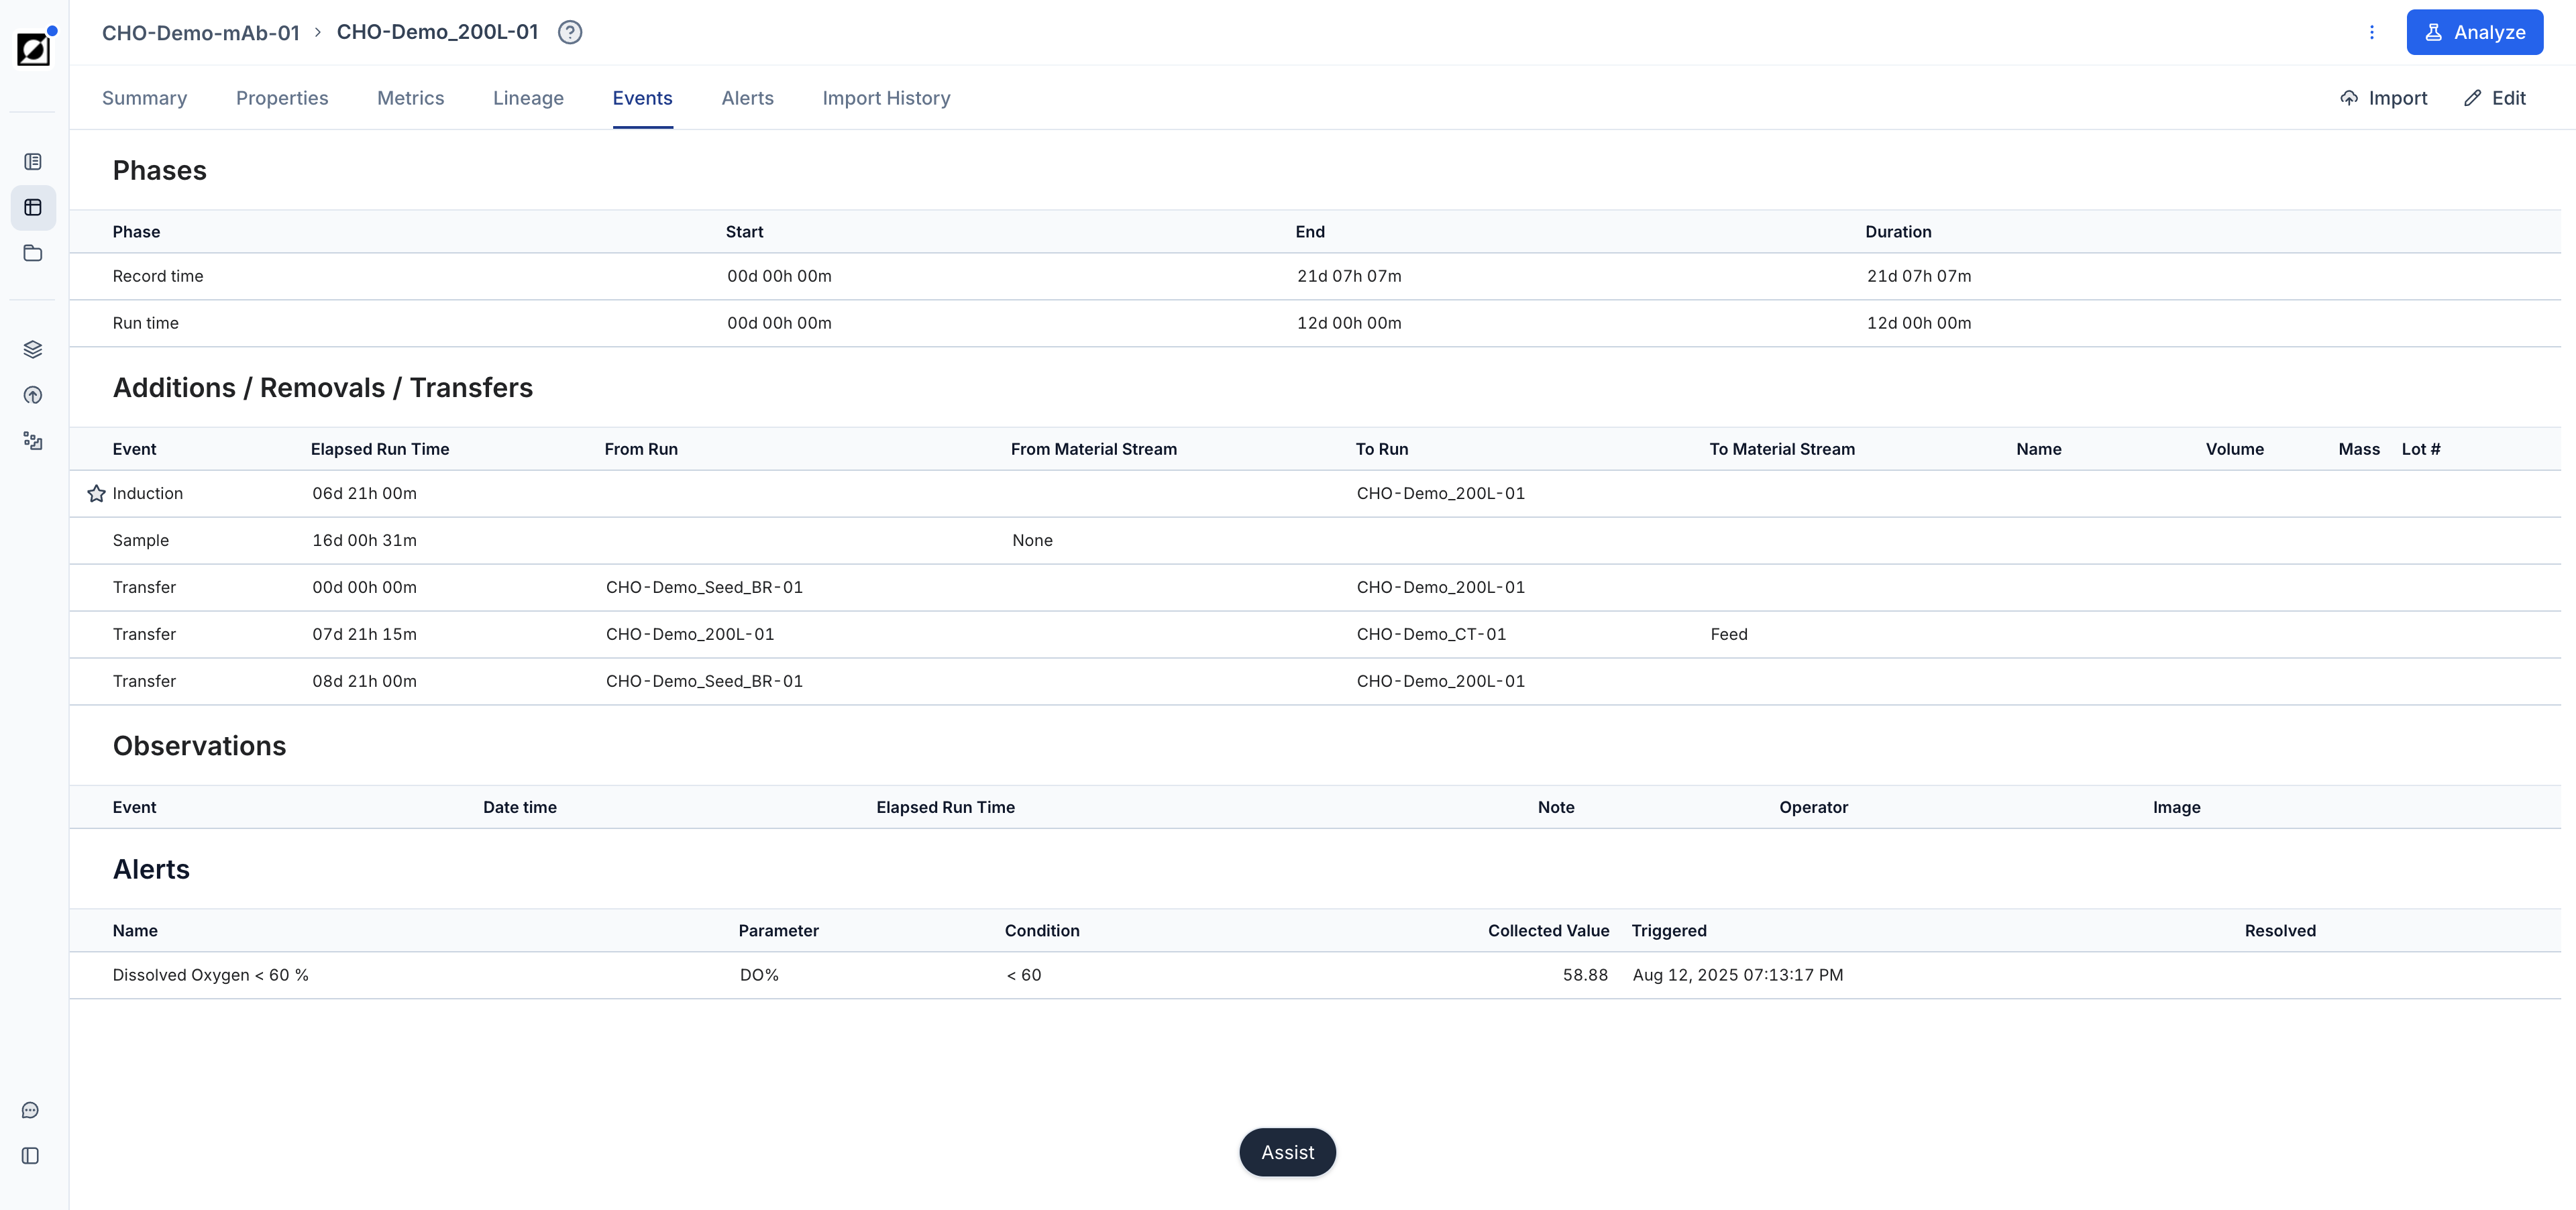
The Events tab facilitates the annotation of timestamped event notes. Users can document important process annotations such as Inoculation, Feed Start, or any other observations or milestones associated with the run. Event notes show in Line Chart enhancing your analysis by providing context to understanding of the bioprocess workflow.
Alerts
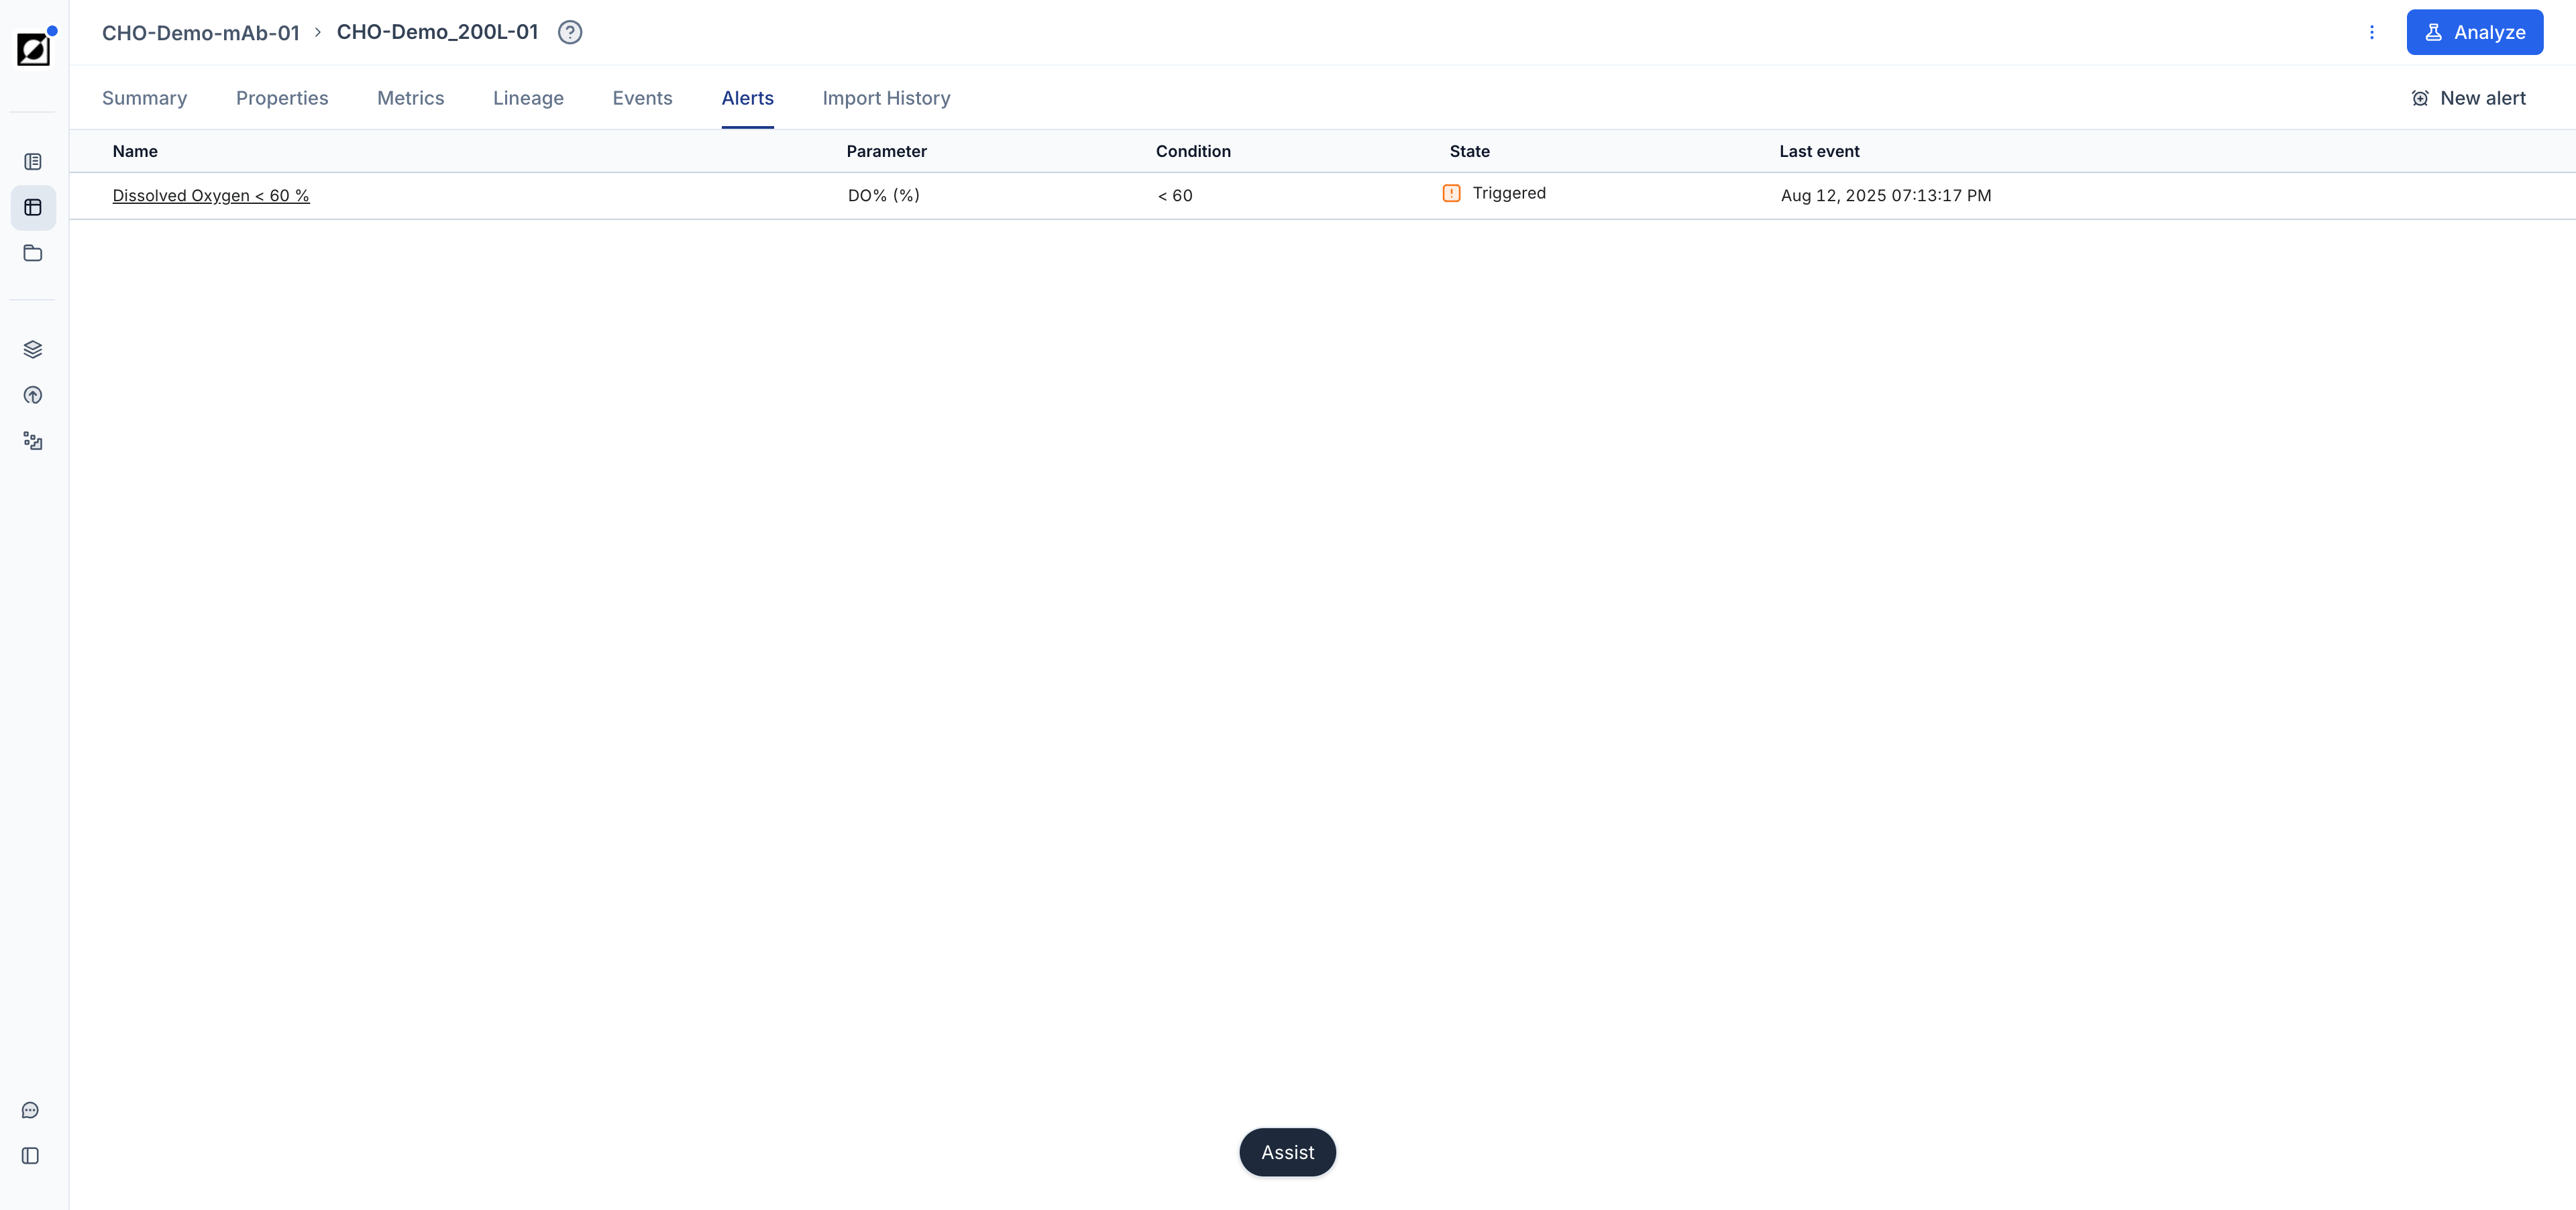
The Alerts tab allows users to manage alerts. An alert is a service that is available to users with data streaming into the app in real time via hardware integration. Users can opt into the service and have Invert sent automated notifications emails and create events when condition is reached. Example: Dissolved Oxygen <60 %.
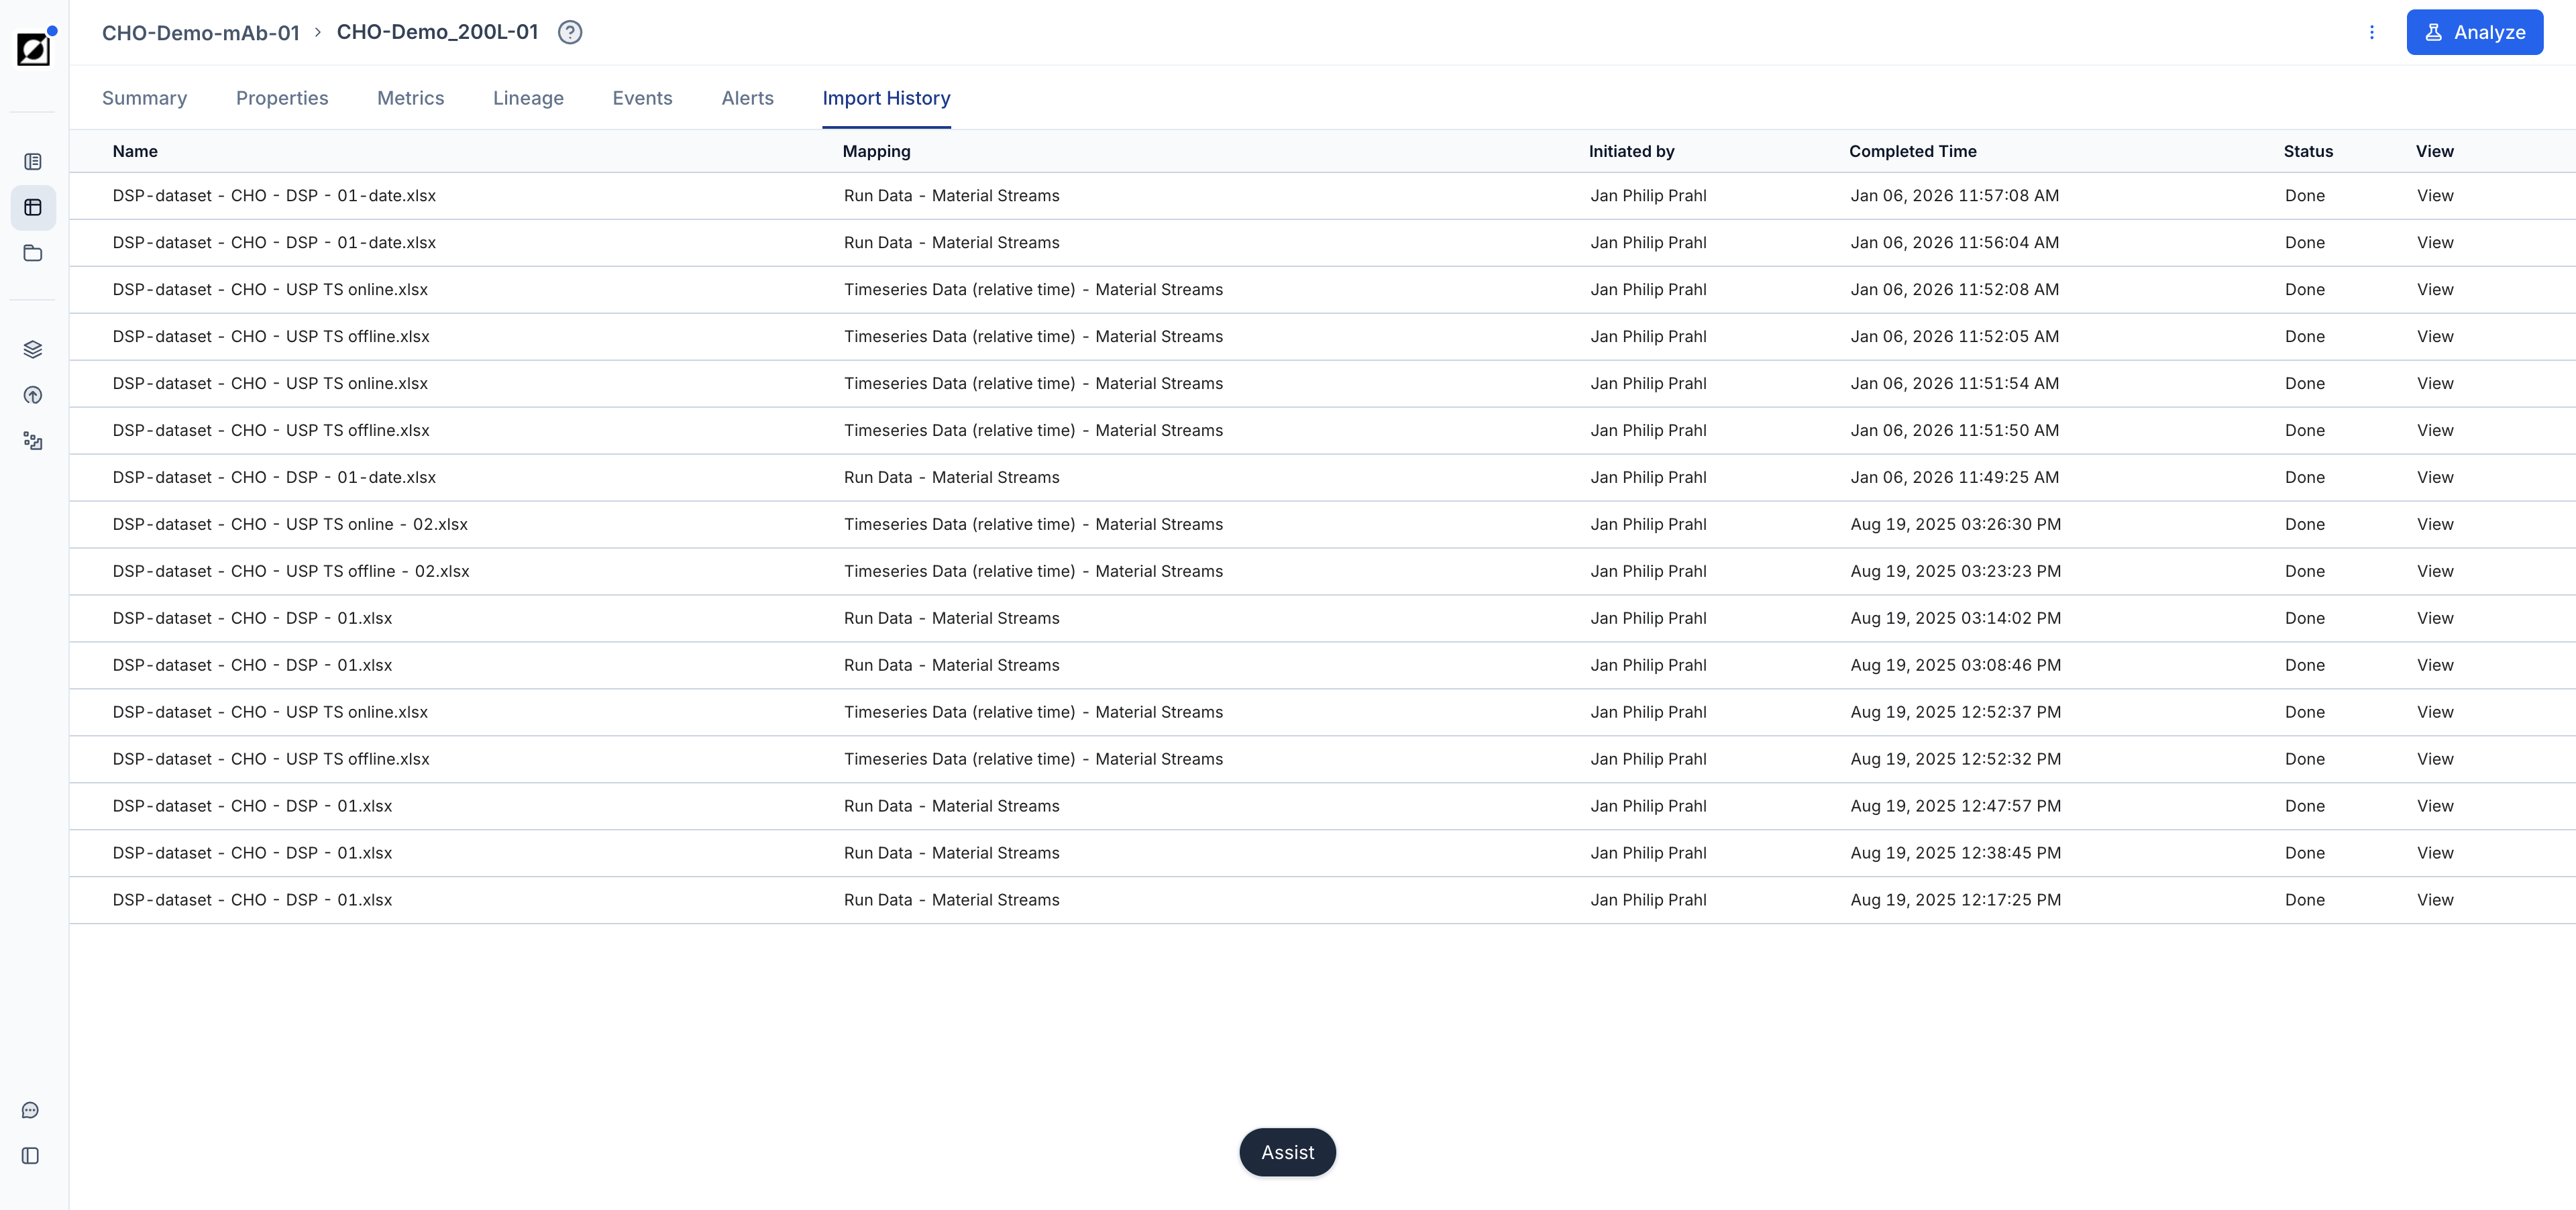
Import History
The Import History tab shows the file upload history for a given run providing insights on the origin of data at a single glance. Each entry in this table links to the relevant page on the Import History tab for additional insights on mappings used, metrics uploaded, etc.