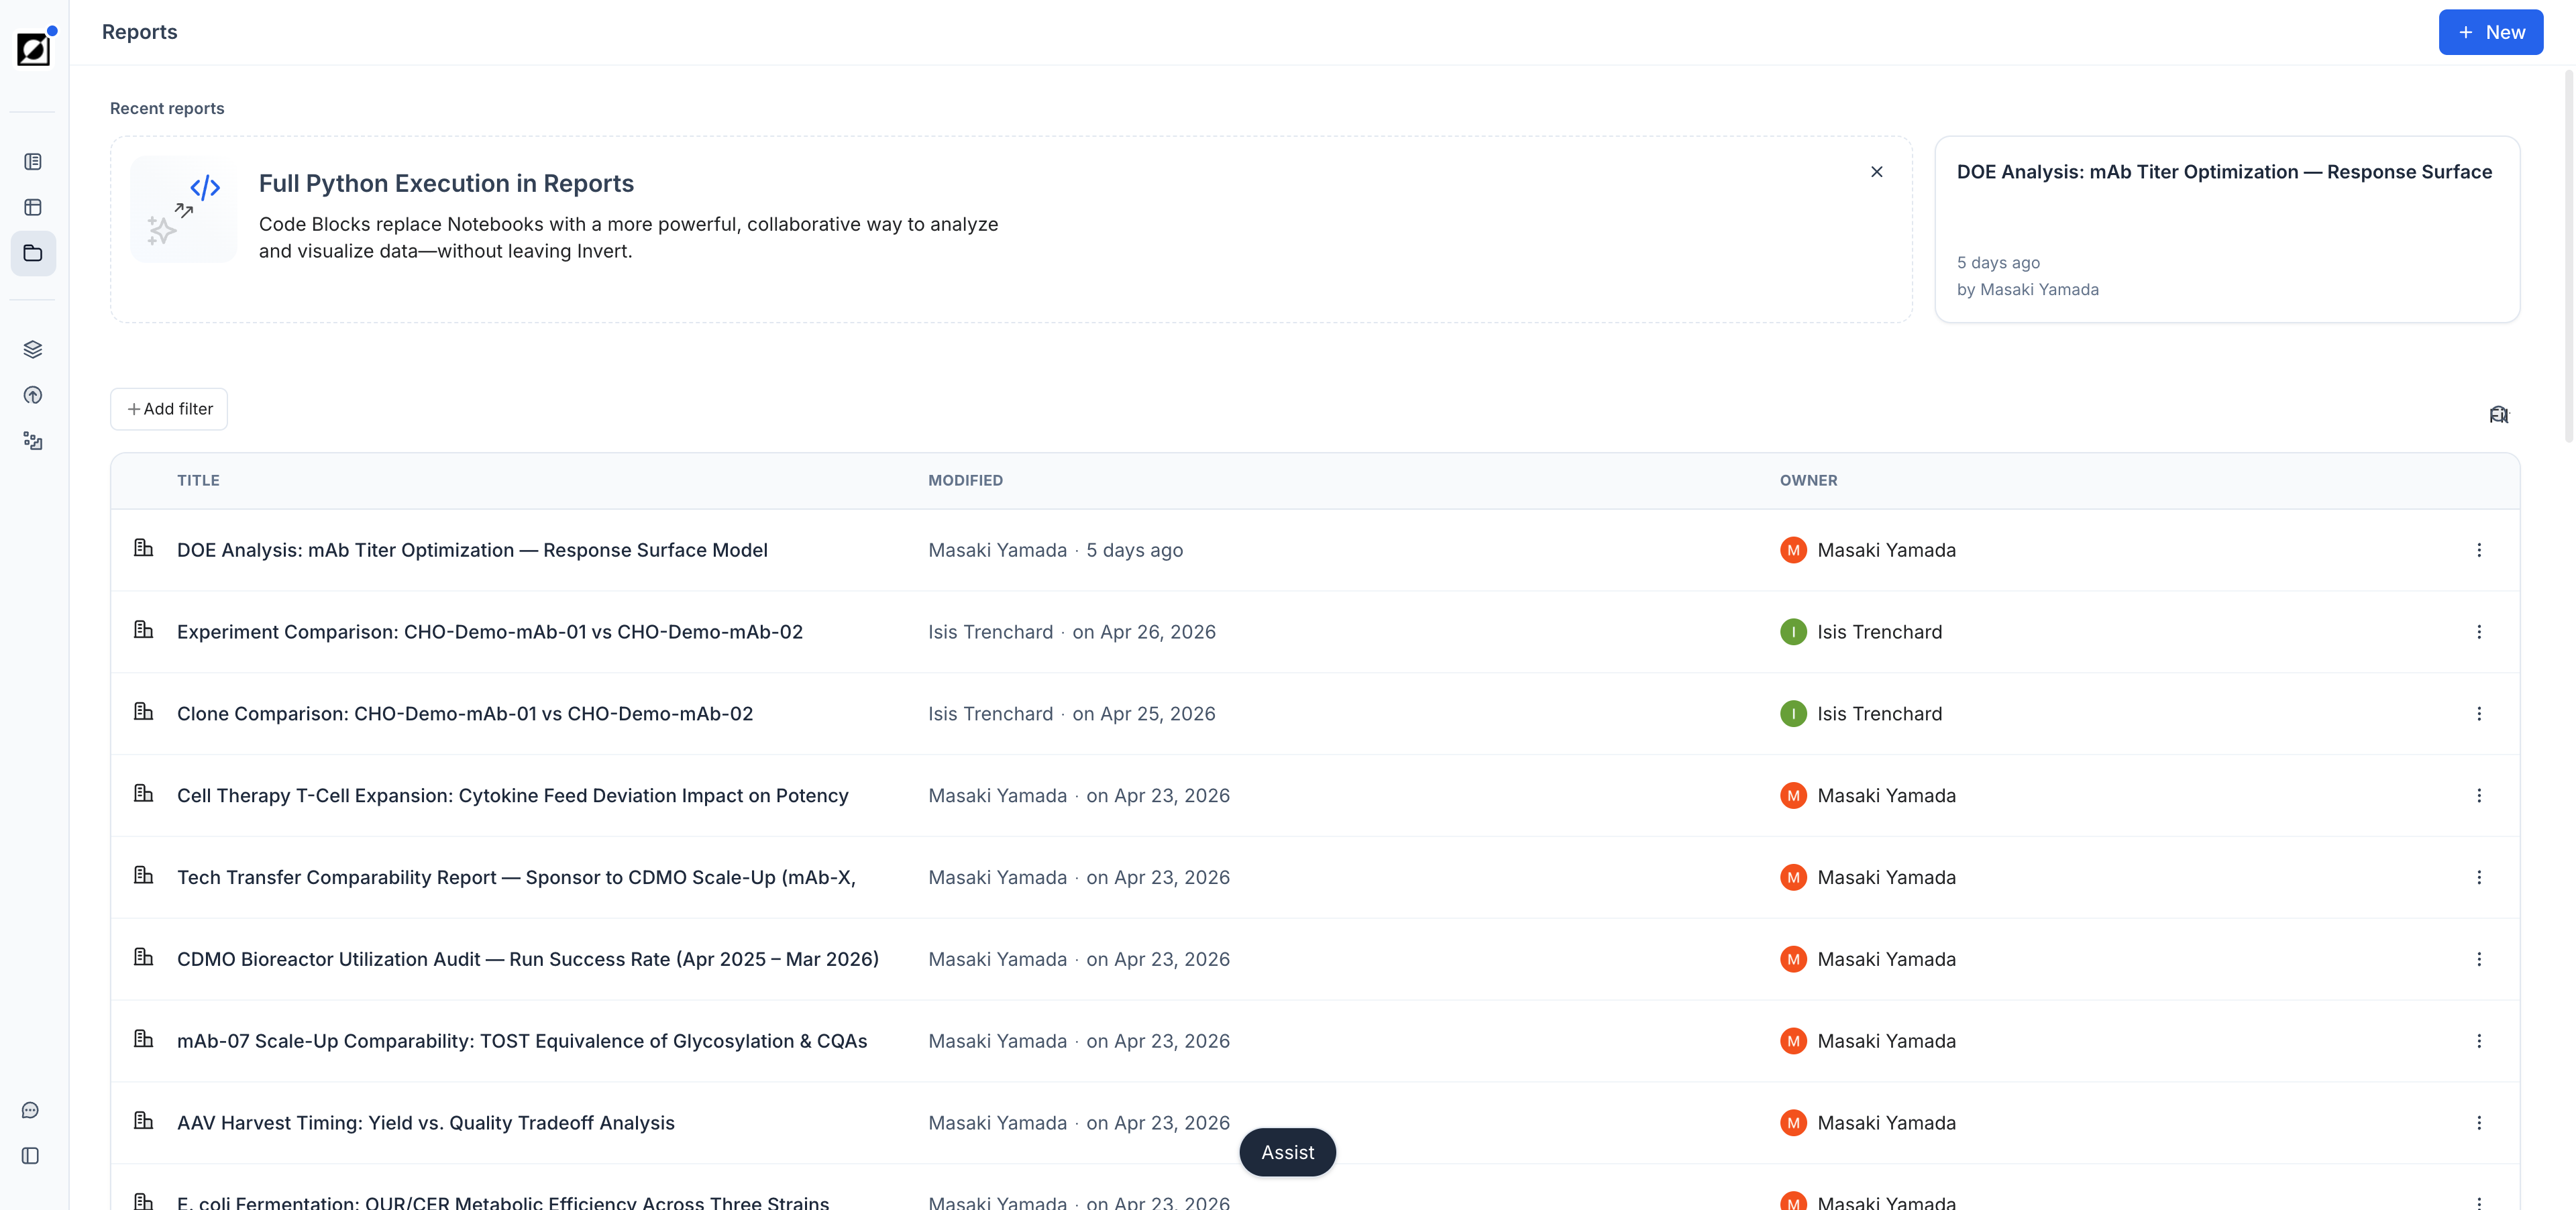
Adding Content
In report editing mode, click the + button between blocks to open the Insert menu. Every piece of content in a report is a block, and blocks can be reordered, duplicated, or deleted independently.
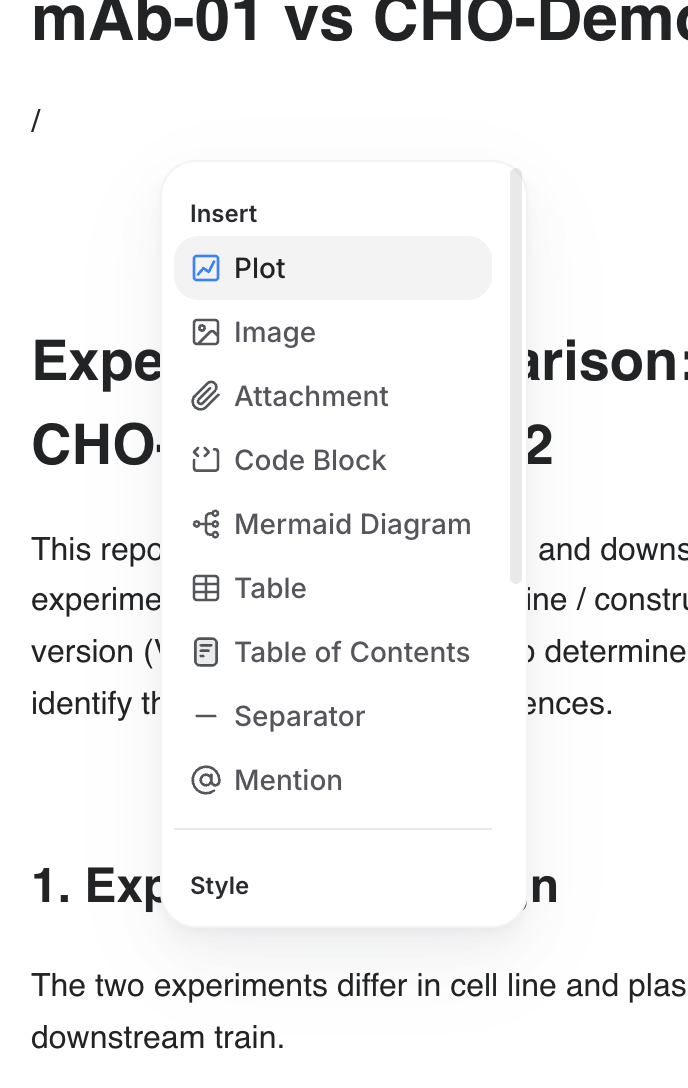
The available block types are:
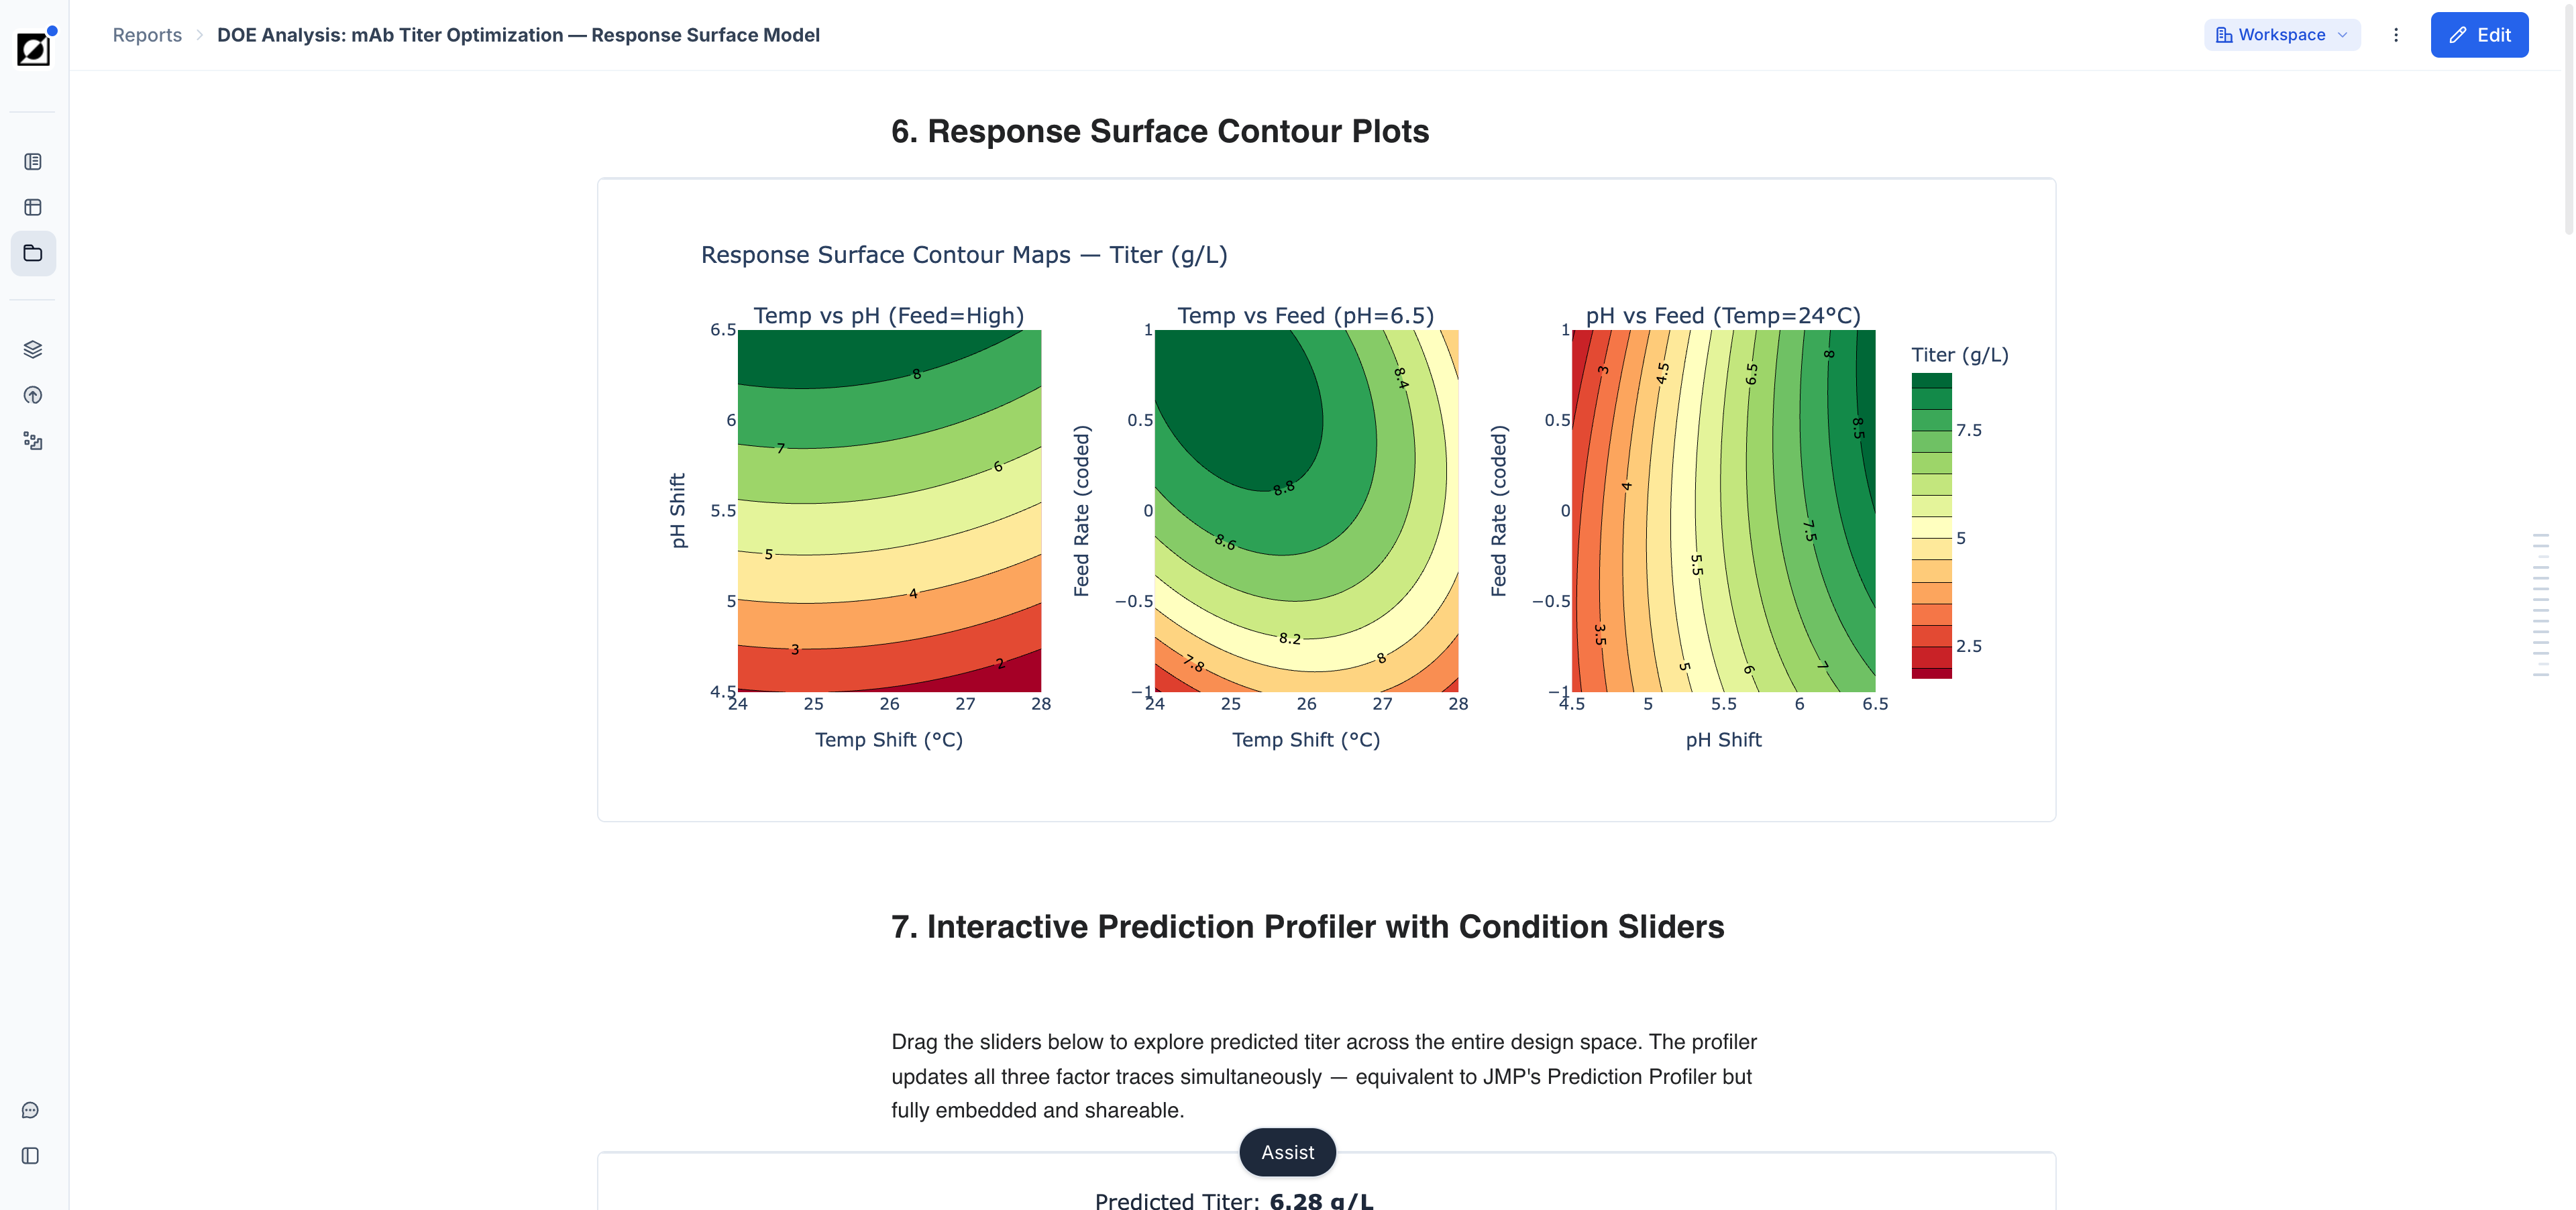
- Plot — A chart (line, scatter, or bar) paired with a run data table and a title/description field. This is the primary block type for data visualization. For details on chart configuration options, see the Analysis article.
- Image — Embed an image directly in the report body, useful for annotated screenshots, microscopy images, or process diagrams.
- Attachment — Link a file attachment (e.g. a raw data file, an instrument export, or a protocol document) so it is accessible alongside the analysis.
- Code Block — Execute custom Python analysis inline within the report. Results, plots, and tables appear directly below the code. See Code Blocks below for details.
- Mermaid Diagram — Render flowcharts, process diagrams, or decision trees using Mermaid syntax, without leaving the report editor.
- Table — Insert a structured data table for presenting values, comparisons, or reference data.
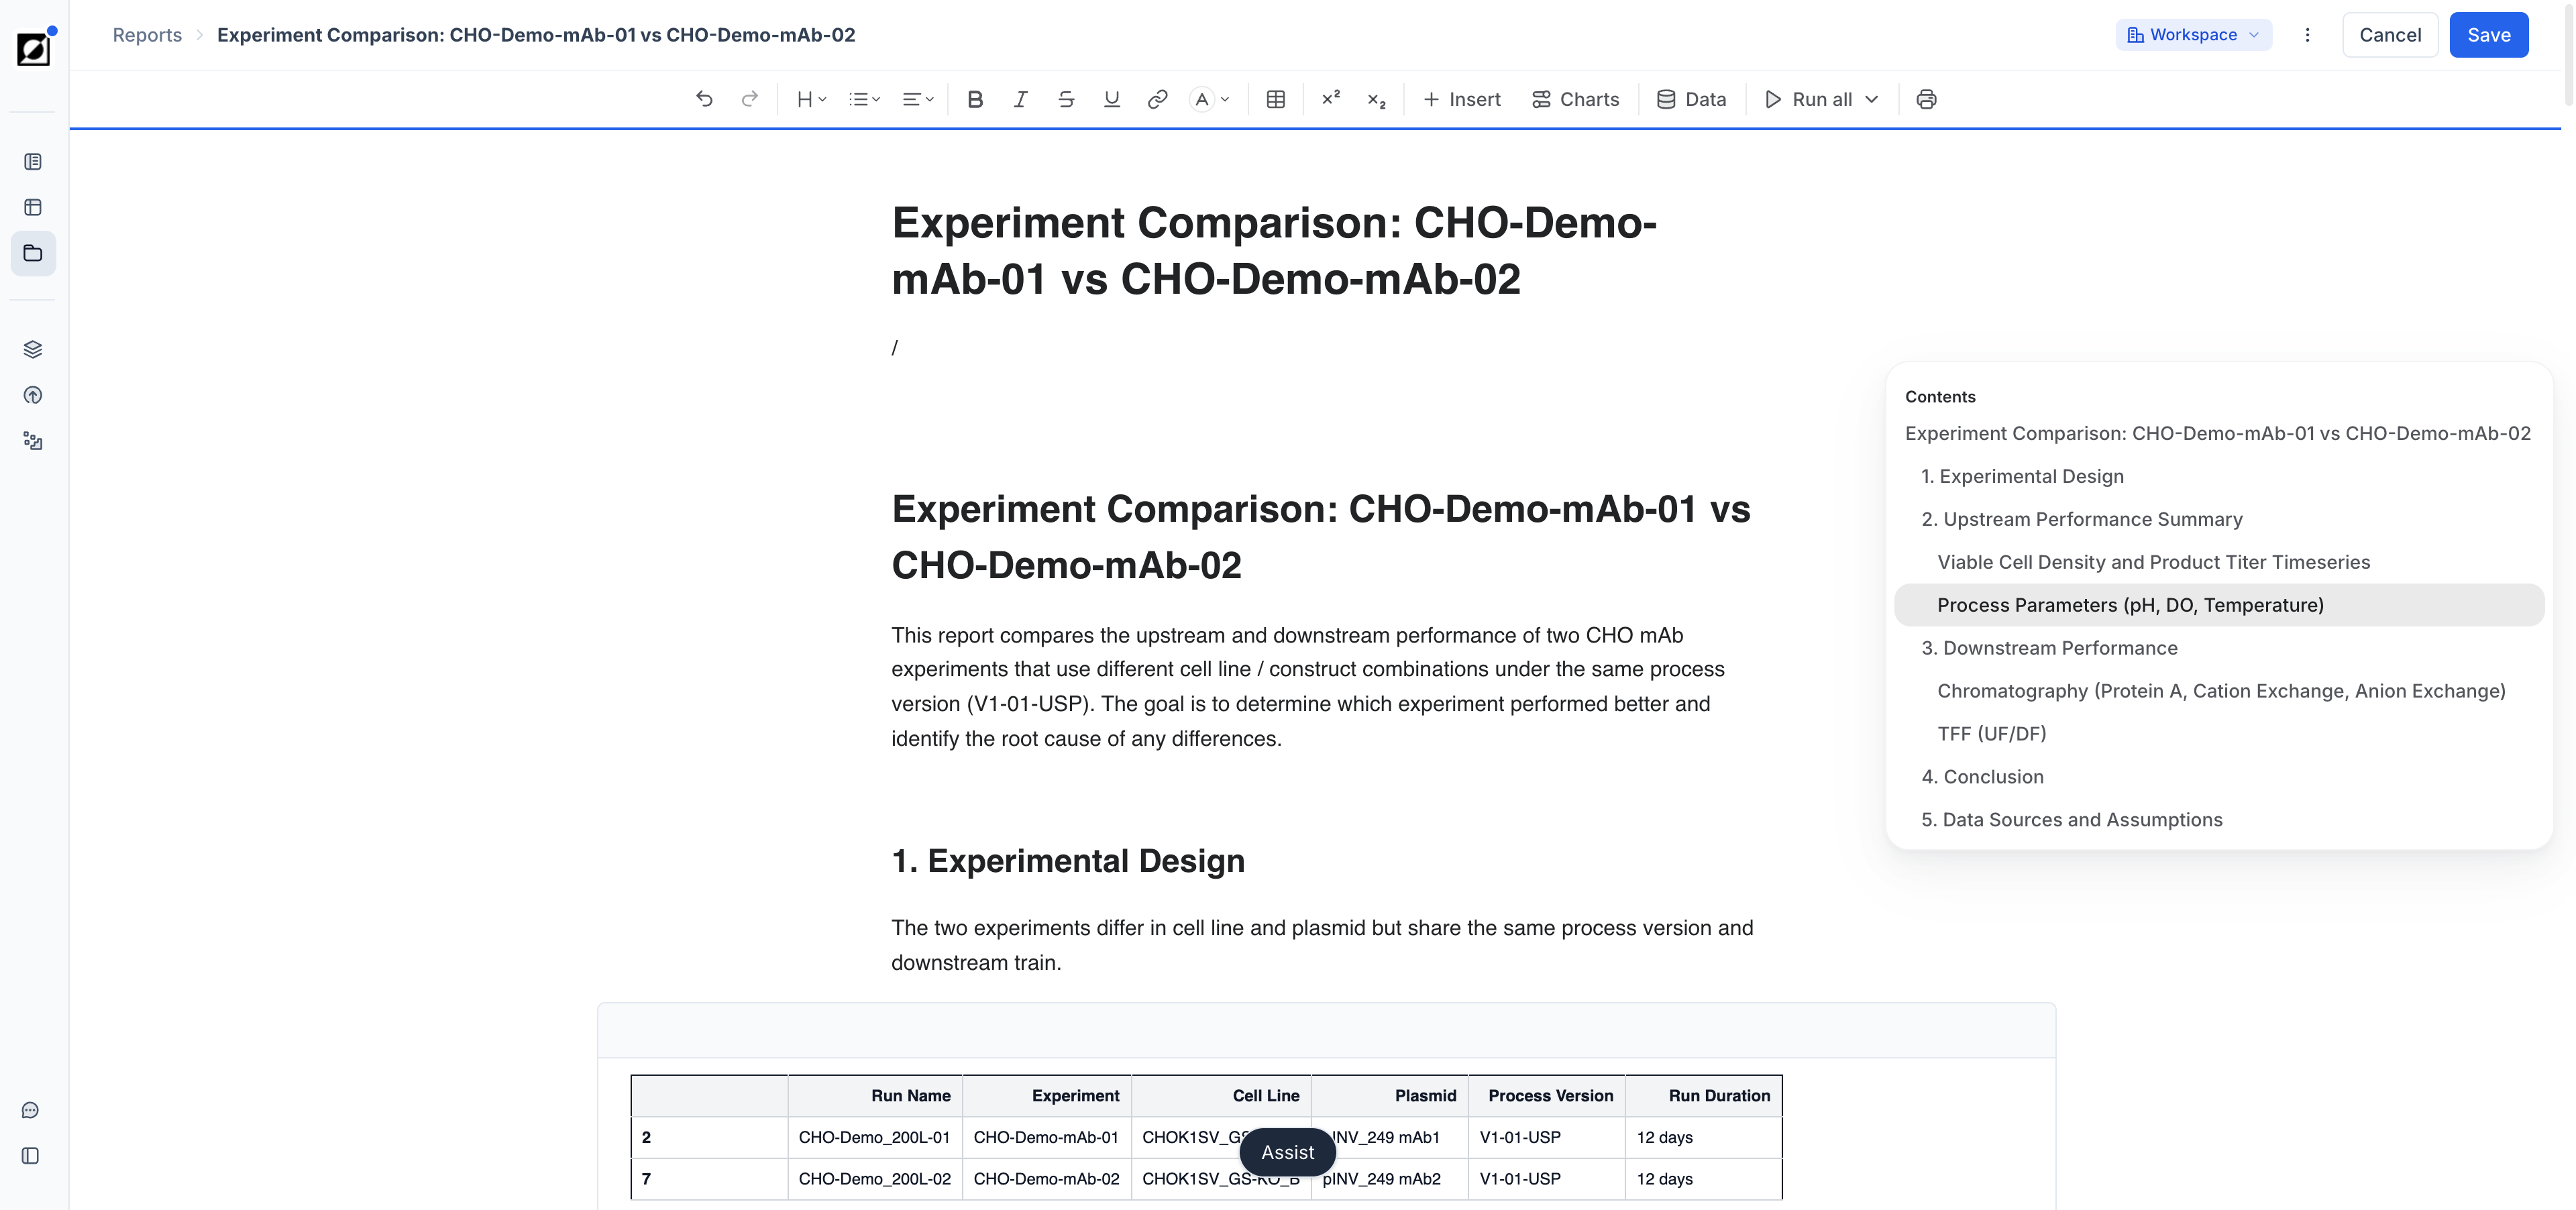
- Table of Contents — Automatically generate a linked navigation index from the headings in the report — useful for longer documents.
- Separator — Insert a horizontal rule to create visual breaks between sections.
- Mention — @mention a team member to draw their attention to a specific section of the report.
- Inline Math — Insert typeset equations using LaTeX syntax anywhere in your text, powered by KaTeX. Useful for documenting kinetic models, mass-balance equations, or statistical expressions directly in the report.
Code Blocks
Reports support Python Code Blocks, allowing you to execute custom analysis directly within your report. Code blocks enable advanced data transformations, calculations, and visualizations without leaving Invert.
When to Use Code Blocks
Code blocks are useful for:
- Custom calculations: Compute metrics not available as formulas (e.g., specific yield calculations, kinetic parameters)
- Advanced visualizations: Create custom charts beyond standard line and scatter plots
- Data transformations: Reshape or filter data to highlight specific insights
- Batch processing: Analyze multiple runs with custom logic
Creating a Code Block
- In report editing mode, click the + Insert button and choose Code Block
- Write your Python code in the editor
- Click 'Execute' to run the code
- Results display inline in your report—output, tables, and plots appear immediately below the code block
Available Libraries and Data
Code blocks have access to:
- pandas: DataFrame operations, grouping, aggregations
- numpy: Numerical computations
- matplotlib/seaborn: Plotting and visualizations (recommended for reports)
- scipy: Statistical analysis, curve fitting
- Your report data: Access bioprocess runs, metrics, and properties loaded in the report
Example Code Block
import numpy as np
import pandas as pd
import matplotlib.pyplot as plt

# Example: Calculate specific growth rate
df = pd.DataFrame({
    'time': [0, 2, 4, 6, 8],
    'od': [0.1, 0.2, 0.5, 1.2, 2.8]
})

# Calculate growth rate
df['ln_od'] = np.log(df['od'])
df['specific_growth_rate'] = df['ln_od'].diff() / df['time'].diff()

# Plot results
plt.figure(figsize=(10, 4))
plt.plot(df['time'], df['specific_growth_rate'], 'o-')
plt.xlabel('Time (h)')
plt.ylabel('Specific Growth Rate (1/h)')
plt.title('Growth Rate Analysis')
plt.show()
Tips for Code Blocks
- Keep code simple and focused—complex analysis is harder to review
- Use comments to explain what each section does
- Test calculations with sample data before finalizing
- Use descriptive variable names for clarity
- Avoid external API calls or file operations (sandboxed environment)
Workflow
-
Add New Report:
Navigate to the Reports page and click 'Add new report' to create a blank report. Type the report title at the top of the document — it sits as a fixed first element above the body content and stays in sync with the report name shown in the page header.
-
Add your first Plot block:
Click the + Insert button and choose Plot. Enter a title and description, click 'Select Runs', and choose the relevant runs. Then configure your chart — select metrics, chart type, and layout — and press 'Done'. You can return to edit the chart at any time via the 'Edit Plot' button on the block.
-
Build out the report:
Use the Insert menu to add additional blocks — more plots, code blocks, images, tables, or text separators. Duplicate any existing block to carry forward its run selection and chart settings, which speeds up building multi-chart reports. Blocks can be reordered by dragging.
-
Save and Share:
Once your report is complete, save it by clicking the 'Save' button. Share the report with collaborators by selecting the 'Copy Share Link' option after pressing the 'Share' button. For organizations with report user access enabled, you can also control which users or groups within your organization can view or edit a report through the 'Share' dialog — useful for managing access to sensitive analyses. Personal reports (not yet shared) remain owner-only in report lists but can be opened by teammates in read-only mode via a direct link. Sharing reports with users outside your organization requires assistance from Invert support — contact us via Help & Support to arrange this.
-
Report Archiving:
To remove a report from the list, press the 'Archive' button accessible in the top right corner of the report.
-
Additional Actions:
Duplicate a report to create backups or use it as a starting point to streamline the analysis of related experiments. For bulk editing run selection across all plot blocks within a report, press 'Run selection' in the top right corner of the screen and modify run selection.
Alternative Workflow
-
Start Analysis from Runs Page:
Alternatively, you can begin your analysis from the Runs. Select the runs you're interested in and transfer them to the Analysis page.
-
Visualize Data: Visualize your data using line, scatter, or bar charts. Customize the chart view settings and run data table as needed.
-
Save to Report: Click 'Save' and choose 'Add new report' or 'Add to a report' to incorporate your analysis into a new or existing report.