We gave Invert Assist 40 runs from the same CHO platform, all with the same recipe, cell line, and Feed A. Final titer still ranged from 0.6 to 4.4 g/L, so we asked why. Here’s what it found.
As a process development scientist, you’ve likely seen this before: forty runs, same CHO platform, same Feed A, same everything on paper, but titers that span 0.6 to 4.4 g/L. The instinct is to call it noise, but with variability this large on a controlled process, it’s likely a metabolic switch that some runs make and others don’t.
Early in a fed-batch, cells take up more glucose than they need for energy, and the overflow gets shunted through glycolysis into lactate. As glucose becomes limiting, healthy cultures flip their metabolism and begin consuming the lactate they produced. pH stabilizes, growth slows, and the culture settles into a productive stationary phase as titer climbs.
Keep glucose too rich for too long, and cells keep producing lactate past the point they should have switched. Lactate accumulates, pH drops, growth stalls, and the run never recovers. A few g/L of extra glucose early on is enough to strand a culture on the wrong side of that switch for good.
That metabolic switch doesn’t show up in any single measurement or single timepoint. You only see it as a pattern across glucose, lactate, and pH over the full run. Figuring out which parameter distinguishes the forty runs that succeeded from the ones that didn’t, requires comparing dozens of time series data sets side by side, which isn’t a problem most people have time for.
Here’s a specific example
In this illustrative case study, we used simulated data from 40 CHO fed-batch runs to test whether Assist, Invert’s purpose-built bioprocess agent, could identify the early process behavior separating high- and low-titer outcomes.
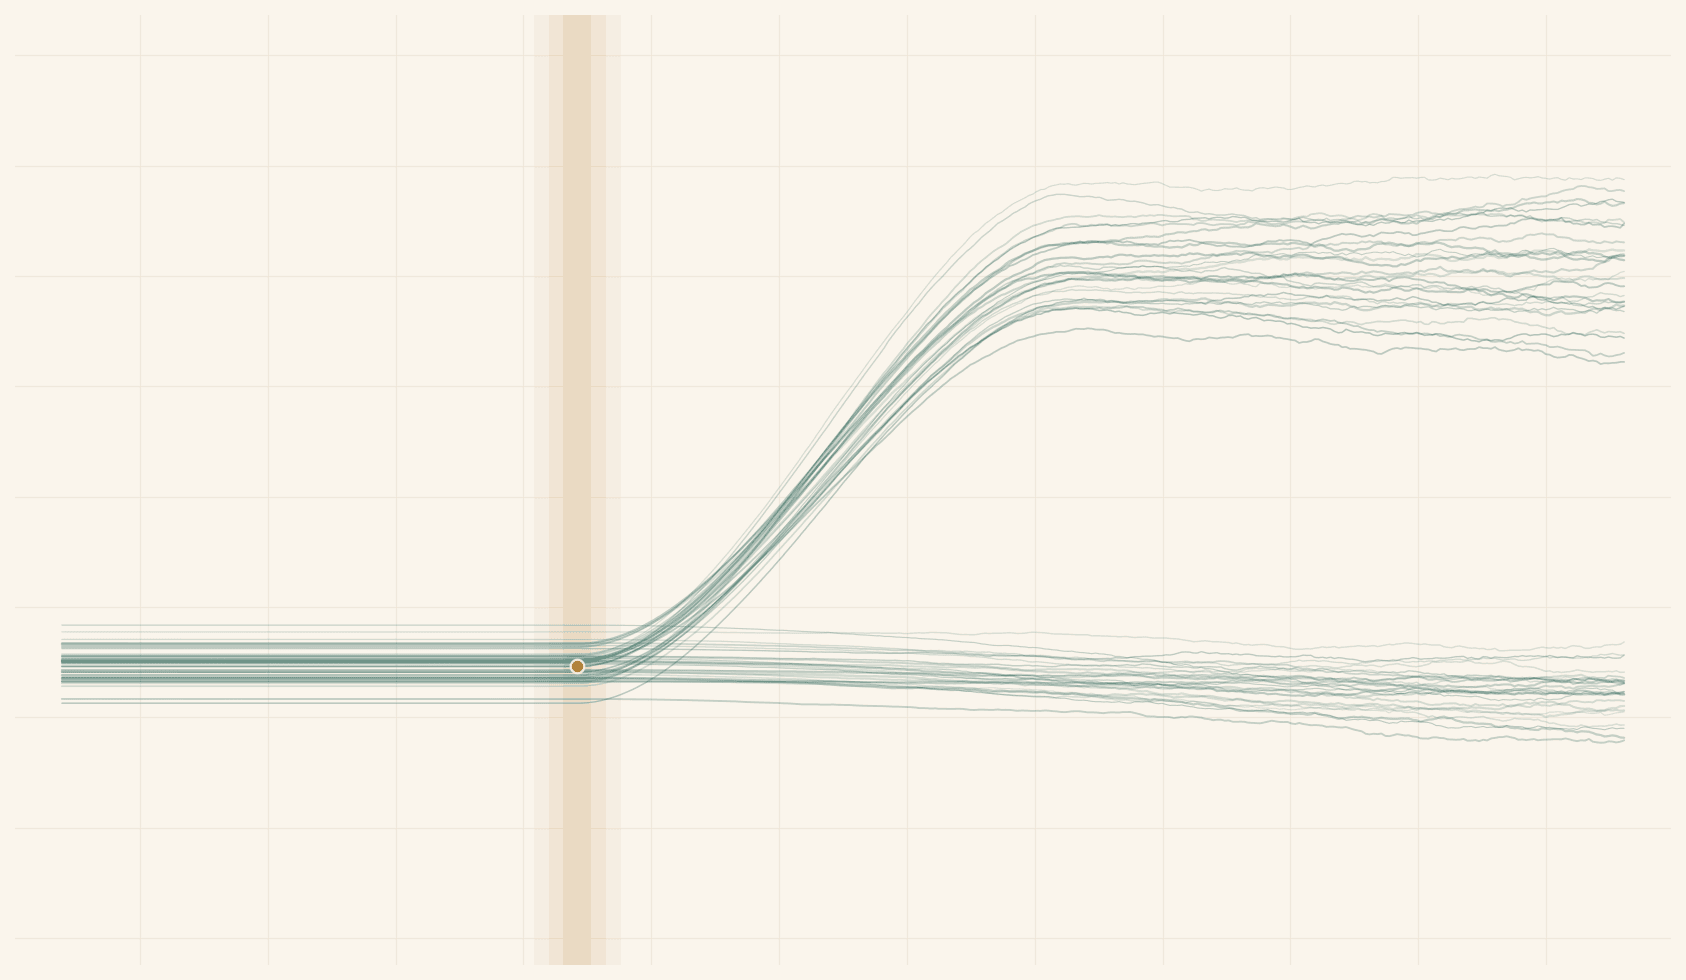
A process development scientist reviewed 40 production runs of the same CHO fed-batch platform (same recipe, same cell line, same Feed A) and asked why final titer ranged from 0.6 to 4.4 g/L. Assist split the runs by their lactate trajectory. The runs that landed above 3 g/L cleared the accumulated lactate by mid-culture; the runs that crashed below 1.5 g/L never made the shift. Lactate kept climbing past 3.5 g/L, pH drifted down, and growth stalled early. The dividing line was the glucose feed target: the failing runs ran about 2 g/L richer and stayed locked in net lactate production.
What Assist did
Assist consolidated the 40 runs’ time-series data together (i.e. glucose, lactate, pH, viable cell density), normalized against the batch start times, then clustered the runs by their lactate profiles, all in under 2 minutes. A key parameter that influenced titer was the amount of glucose each run carried early in the fed-batch, and this pattern became clear when the runs were read as one dataset.
That makes the lactate curve more than a retrospective explanation. It becomes an early indicator of whether a run is moving toward a productive state, giving teams time to adjust the feed strategy days before the final titer is available.
Only because data was connected
Invert brings time-series, assay, and run-context data from many batches into a single analysis environment, allowing Assist to compare process trajectories across the full dataset rather than treating each run as an isolated file. The result is a clear and quantitative understanding of how the process actually behaves.
Illustrative example using simulated synthetic process data.