Source paper: Richelle A, Corbett B, Agarwal P, Vernersson A, Trygg J, McCready C (2022). Model-based intensification of CHO cell cultures: One-step strategy from fed-batch to perfusion. Front. Bioeng. Biotechnol. 10:948905. — Frontiers · PDF · doi:10.3389/fbioe.2022.948905
We used Invert Assist to reproduce Richelle et al.'s 2022 model for CHO cell-culture intensification as an interactive report.
Our goal was to replicate the paper by rebuilding the model from the published equations and checking whether the reported behavior reproduced. Assist turned that replication into an executable report, which let us inspect the ODE system, vary assumptions, and run uncertainty analysis around the fitted parameters.
The central replication question was whether parameters identified from small-scale fed-batch experiments could reproduce the paper's media-exchange and perfusion simulations without re-estimating the model.
Assist let us test that question directly. Starting from the published model, it produced an interactive implementation that could be inspected, modified, and stress-tested.
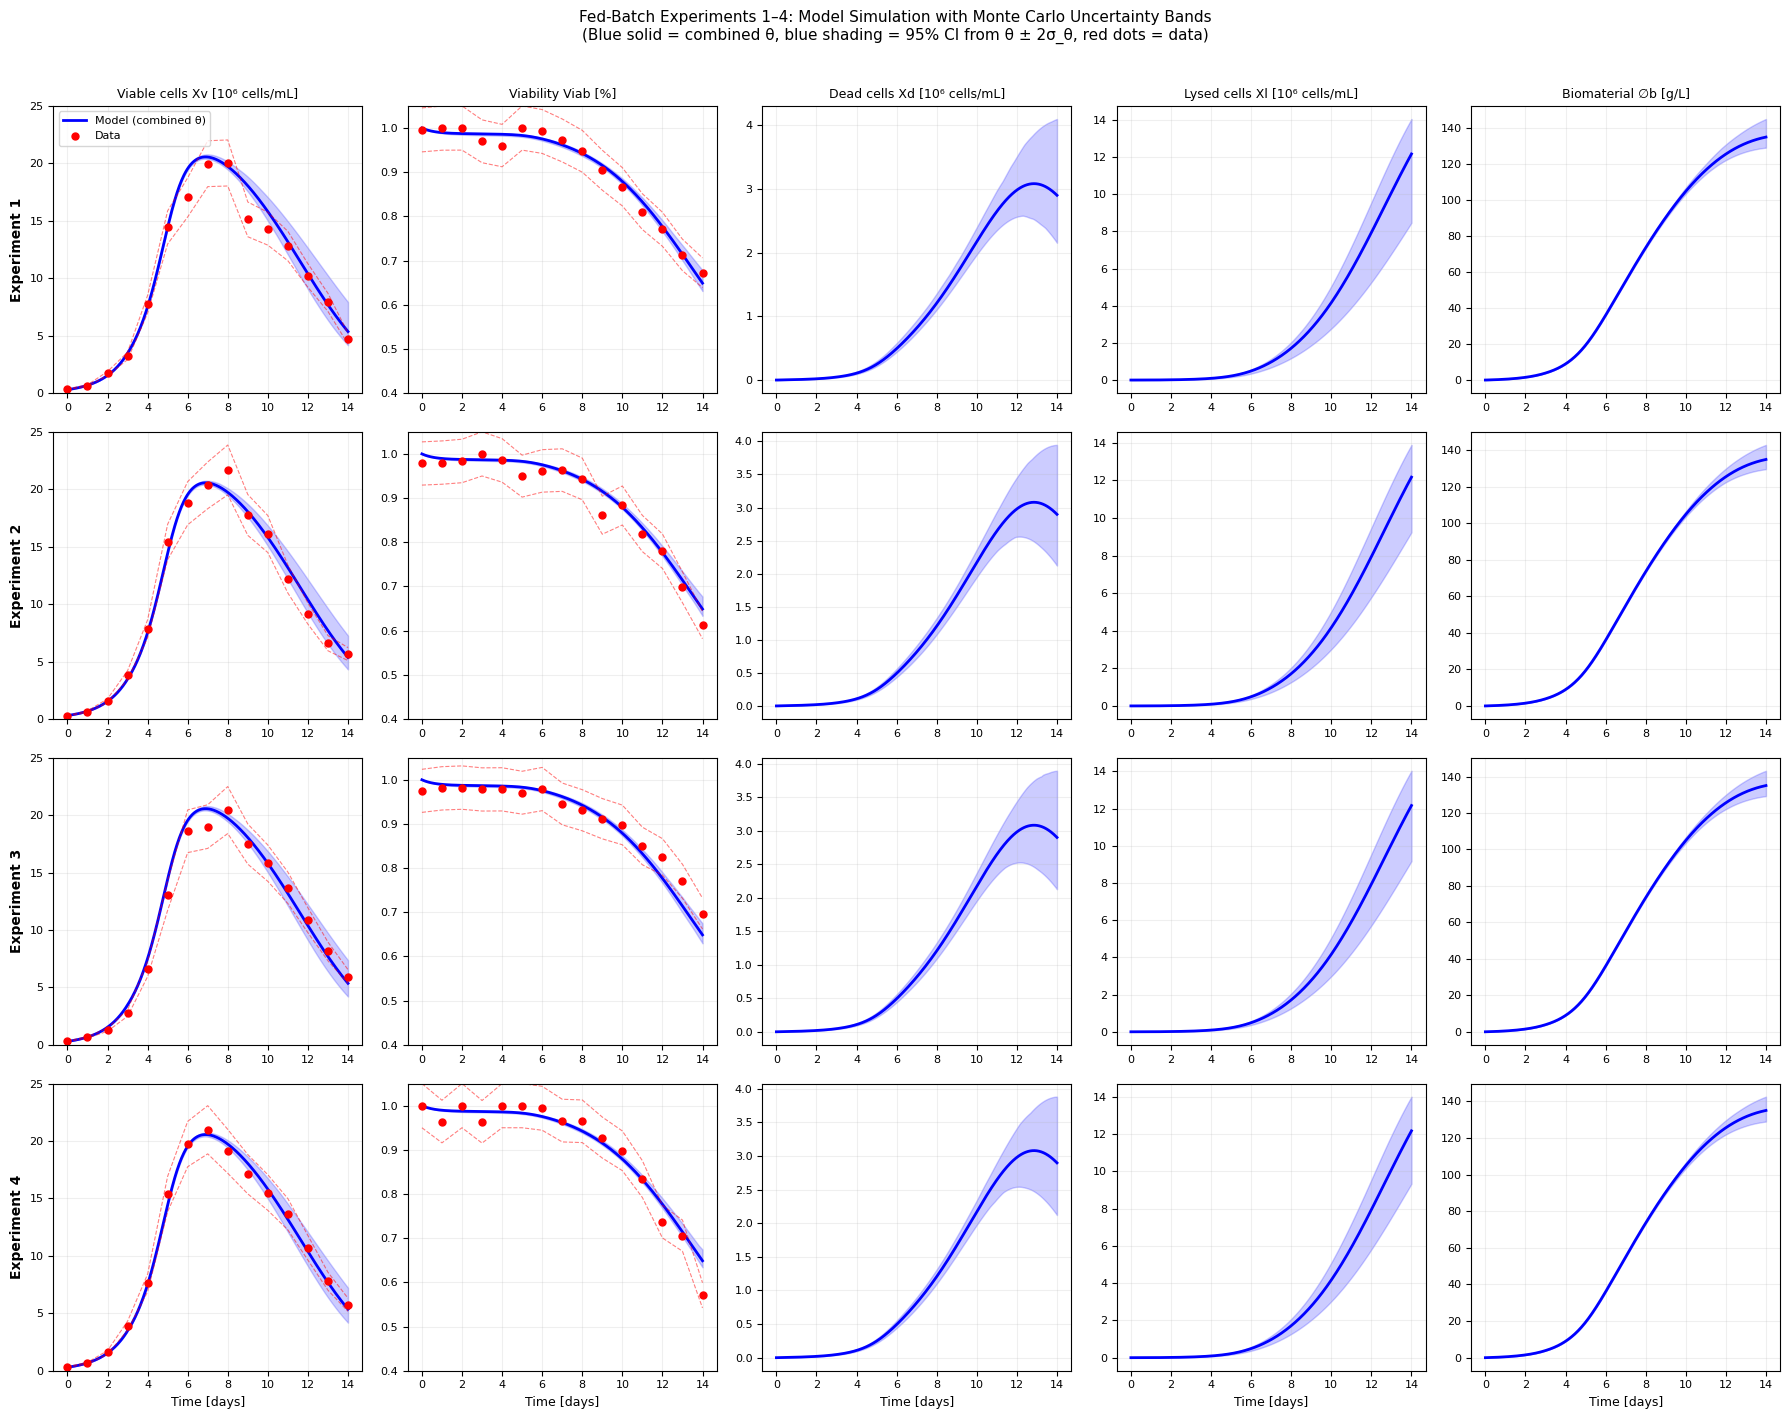
The fed-batch reproduction across all four Ambr250 calibration runs: the model (blue) with 95% Monte Carlo uncertainty bands against the measured data (red), for every model state — viable cells, viability, dead cells, lysed cells, and biomaterial.
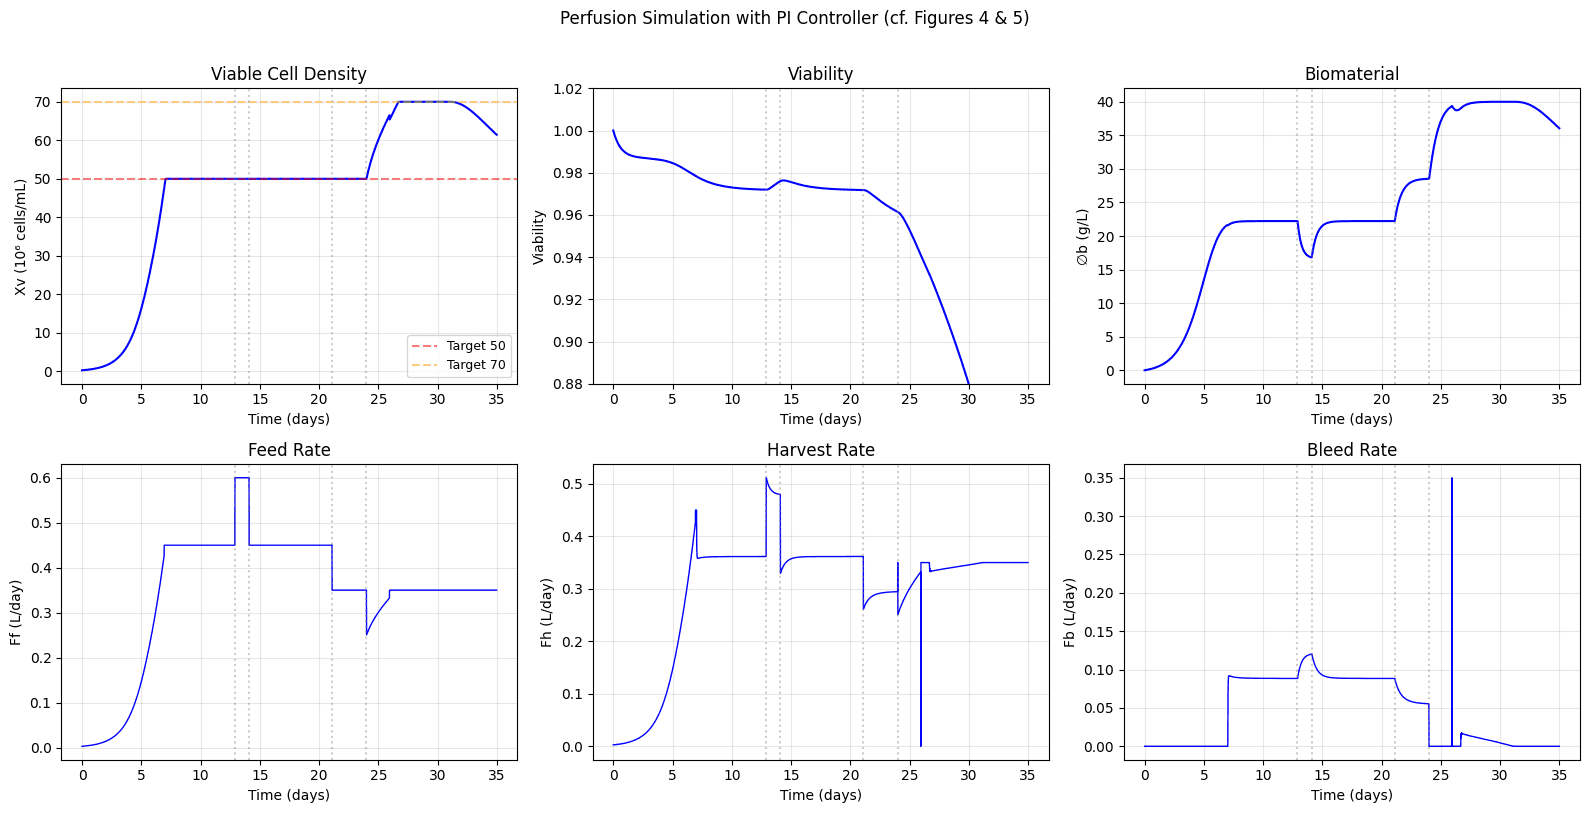
The main result holds up in our reproduction: the same fed-batch-derived parameter set predicts the reported perfusion design, including a sustained target density of 70 × 10⁶ cells/mL held by the PI-controlled bleed, and the viability decline that follows once the culture is driven to that higher target under a reduced perfusion rate.
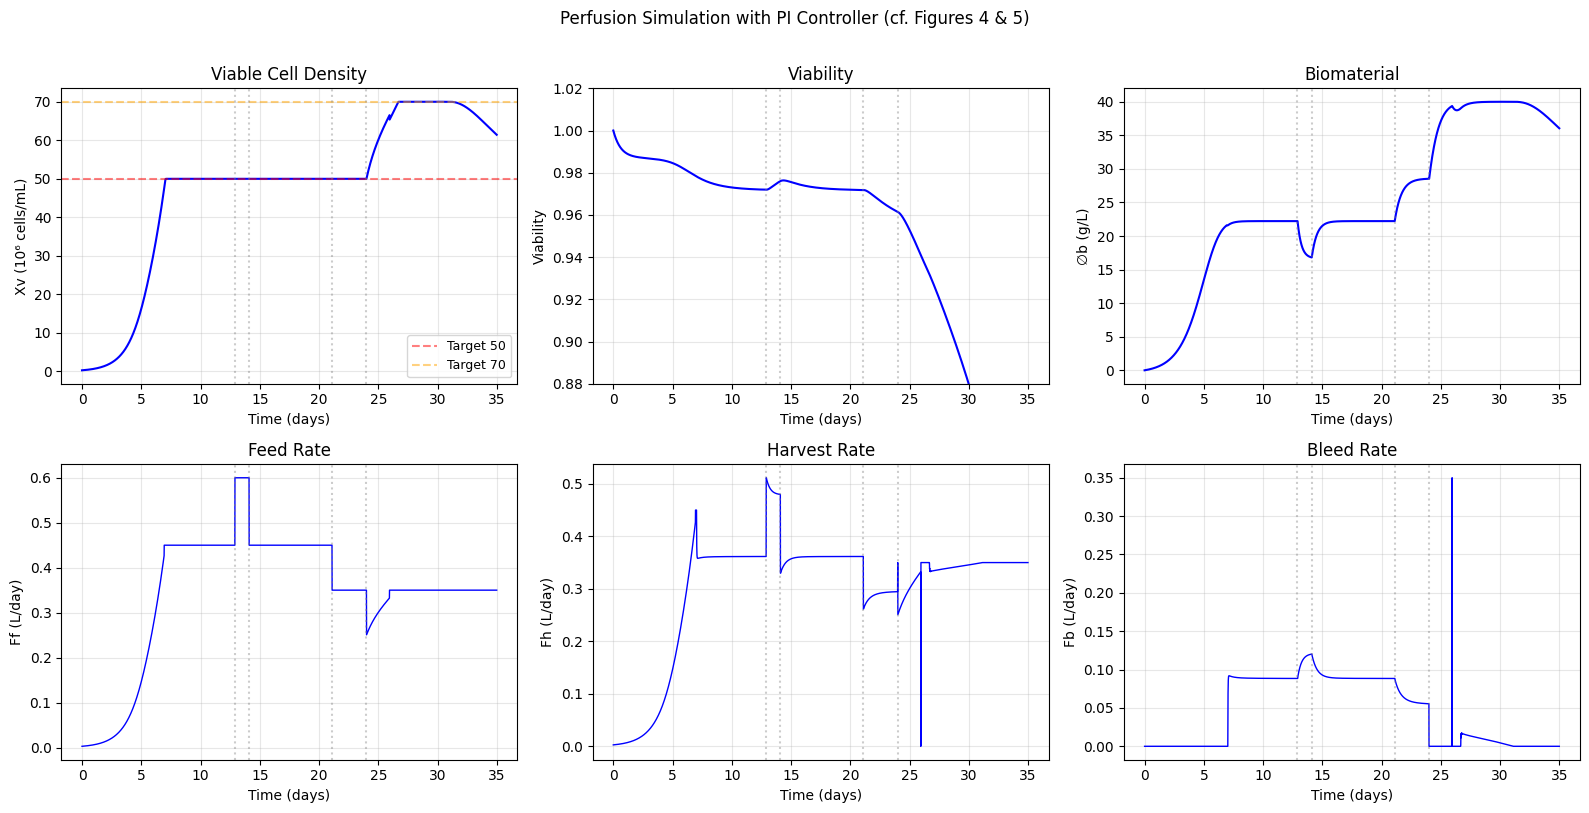
The reproduction reaches and holds the reported 70 × 10⁶ cells/mL target via the PI-controlled bleed, with the expected viability decline once the culture is driven to that target under a reduced perfusion rate.
Some observations from the Assist reproduction:
1. The paper's core abstraction is what makes the model transferable
Richelle et al. take a deliberately compact approach. Instead of explicitly modeling glucose, glutamine, lactate, ammonia, and other metabolites, they collapse inhibitory effects into a single lumped "biomaterial" variable.
The model tracks viable cells, dead cells, lysed cells, biomaterial, and volume. With five fitted parameters, it is calibrated on four fed-batch runs in an Ambr250 and then applied unchanged to intensified media exchange and 2L perfusion.
The useful modeling move is not adding more biological detail. It is removing detail that is hard to identify from the available experiments.
Modeling each substrate and byproduct separately can be useful, but it quickly adds complexity: more assays, more terms, and more parameters to estimate.
The biomaterial state is what makes the model portable. In fed-batch, biomaterial accumulates and eventually limits growth; in media exchange and perfusion, biomaterial is removed through the outlet stream, extending growth. The published parameter set carries across those operating modes without re-estimation.
In our reproduction, the same biomaterial state behaves as reported in the paper:
- Biomaterial accumulation in fed-batch limits growth.
- Biomaterial removal through media exchange and perfusion extends growth.
- The published parameter set carries across operating modes.
2. Reproduction exposed a nomenclature mismatch
The paper lists growth and death rates in units of per hour. Taken literally, the maximum growth rate would imply a CHO doubling time of about 50 minutes, which is not biologically plausible.
The equations point to a different interpretation. Perfusion rate is reported in volumes per day, and the governing balance adds perfusion and growth terms together. Those rates need to share the same time basis. Interpreting the kinetic rates as per day gives a doubling time of about 19.8 hours and reproduces the published behavior.
This does not change the model's conclusions. The simulations are internally consistent. But it is a good example of why executable reproduction is useful: dimensional issues that are easy to miss in a static paper become obvious when the model has to run.
3. The controller absorbs most parameter uncertainty
We ran 1,000 Monte Carlo simulations using the reported parameter confidence bounds.
The cell-density prediction was relatively stable. In the perfusion case, the PI bleed controller absorbs much of the parameter variation and maintains the target density. This is an important distinction: uncertainty in biological parameters does not necessarily translate into uncertainty in the controlled cell-density trajectory.
Viability was less tightly constrained.
Across the 1,000 runs, the lysing rate carried a 2σ confidence interval of ±18% — over ten times wider than any other parameter (the next, the death rate k_d, is ±1.9%). Lysed cells are never measured directly, so the data simply do not pin the lysing rate k_l down.
The practical takeaway is straightforward: if the goal is to tighten viability predictions, measure lysed-cell burden directly. An LDH assay would constrain the part of the model that contributes most to the remaining uncertainty.
4. The model is useful because it stays small
The model does not attempt to predict product quality, glycosylation, charge variants, or detailed substrate metabolism. It also assumes idealized cell retention in the perfusion case.
Those omissions are part of the point. The model is not a full digital representation of the process. It is a compact growth model that transfers across operating modes well enough to support process design.
That makes it a good base layer. Substrate kinetics, titer models, quality attributes, or more advanced control policies could be added later. But the core result does not depend on those additions.
The report below is the Assist-generated reproduction: the full ODE implementation, editable parameters, reproduction plots, perfusion simulations, and Monte Carlo uncertainty analysis.