What is an event?
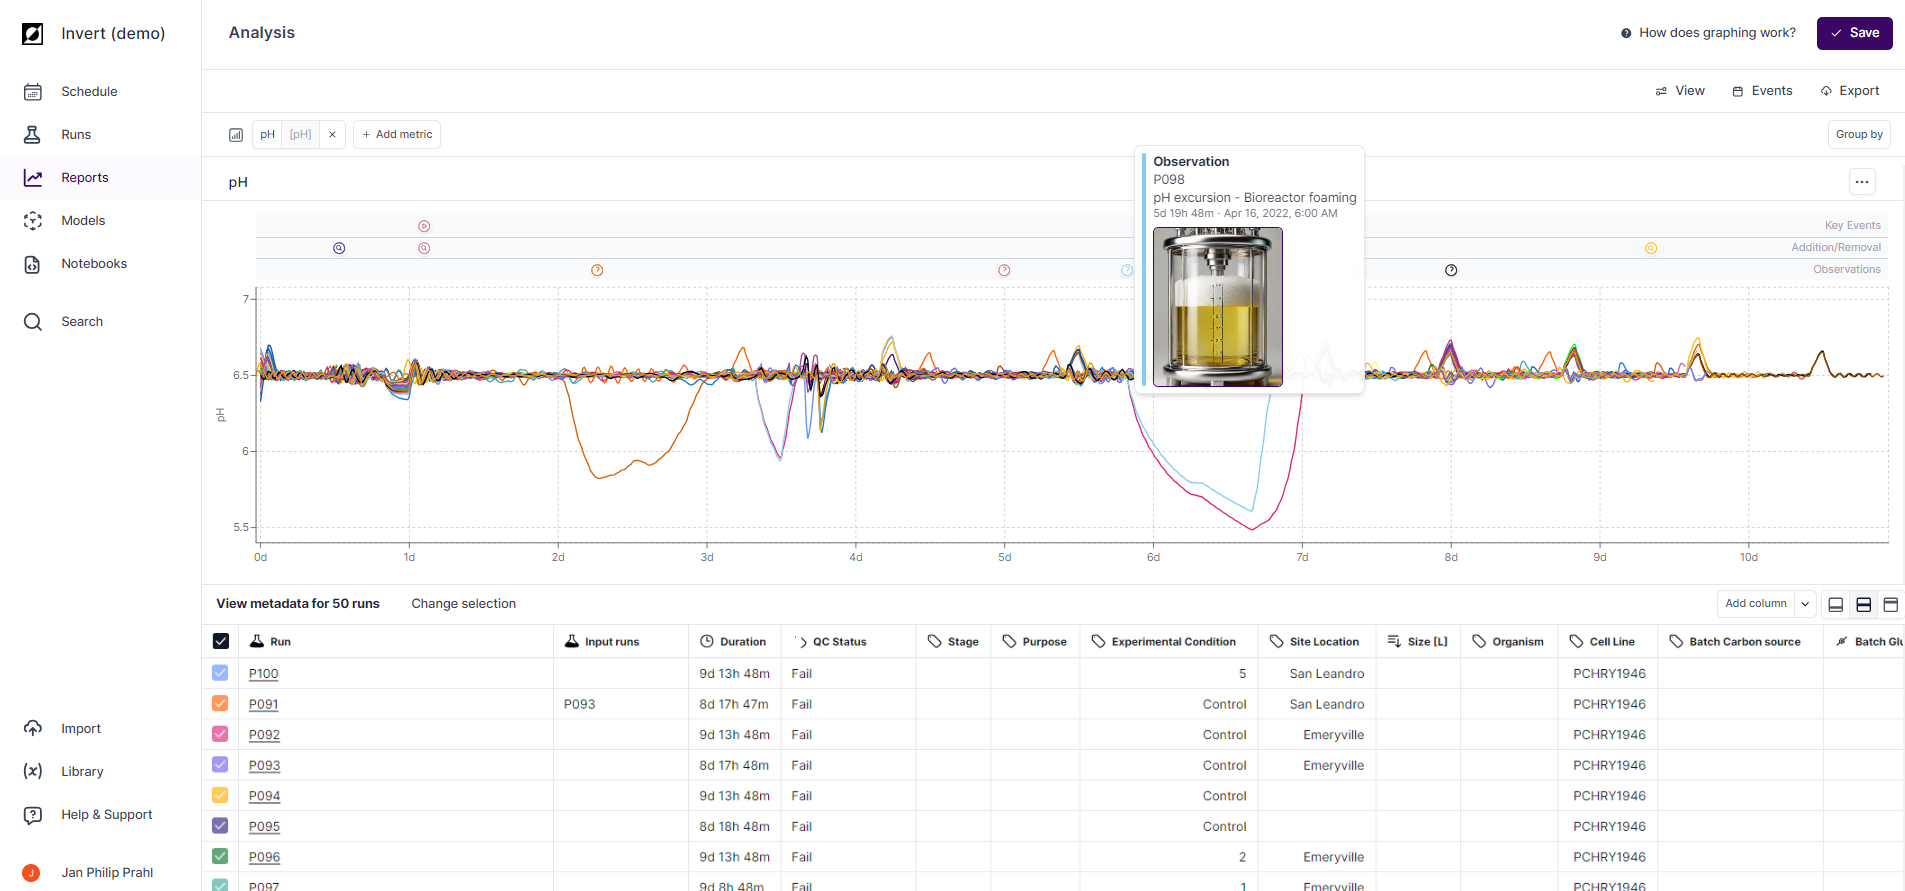
An event is a specific occurrence or milestone within your bioprocess. Users can annotate this data by creating event notes, which are distinct from timeseries data and metadata. Each event note includes details such as event type, timestamp, and optional information like event description, operator, and even image uploads. Event notes are bundled into a single event and displayed on the graph, aligned by its relative timestamp value.
How to create an event
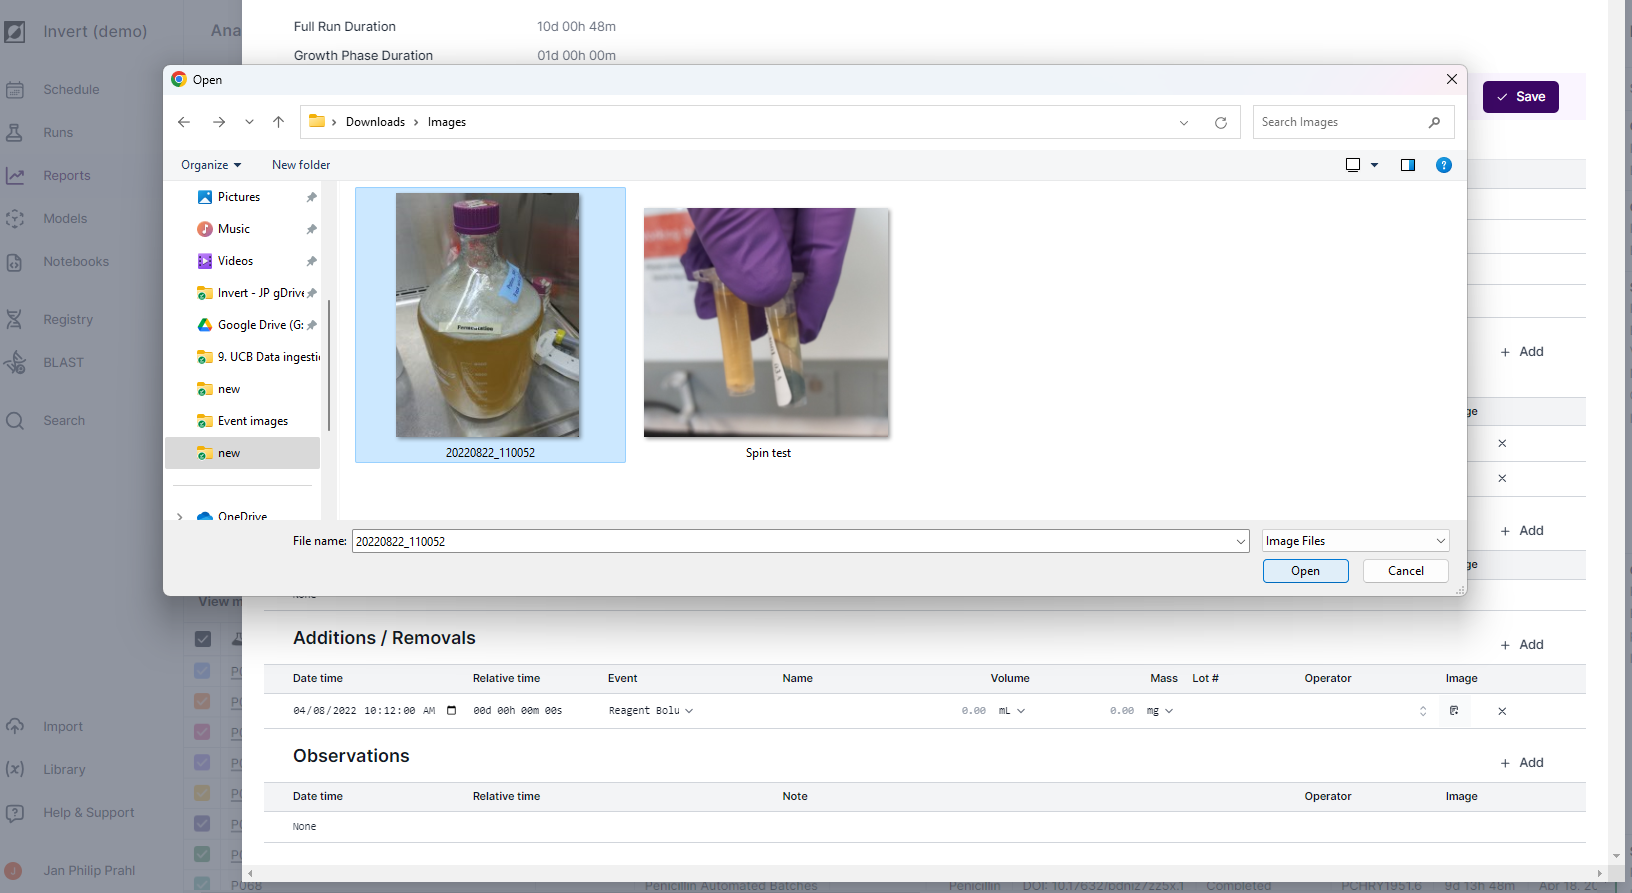
Events are created and managed from the Events tab on the Run Summary page. Navigate to the run, open the Events tab, click Edit, then Add in the desired category. Enter the event time, type, and any optional notes or images, then save.
Image upload
You can attach an image to any event. Images appear in event tooltips on the line chart and can be viewed or downloaded from the Events tab on the Run Summary page.
How can I control which events are shown on the chart?
Event visibility is controlled from the Chart settings panel — click the Chart button in the chart header on the Analysis page. Use the Show events toggle to turn all event annotations on or off. When events are on, use the category buttons — Phases, Additions / Removals, and Observations — to show only the event types relevant to your current analysis.
Event categories and Event types
Phases
- Growth (Start/End), Production (Start/End)
Critical Operations
- Inoculation, Induction, Feed Start, Transfection
Additions / Removals
- Sample, Drawdown, Foamout, Harvest, Reagent bolus
Observations
- Observations