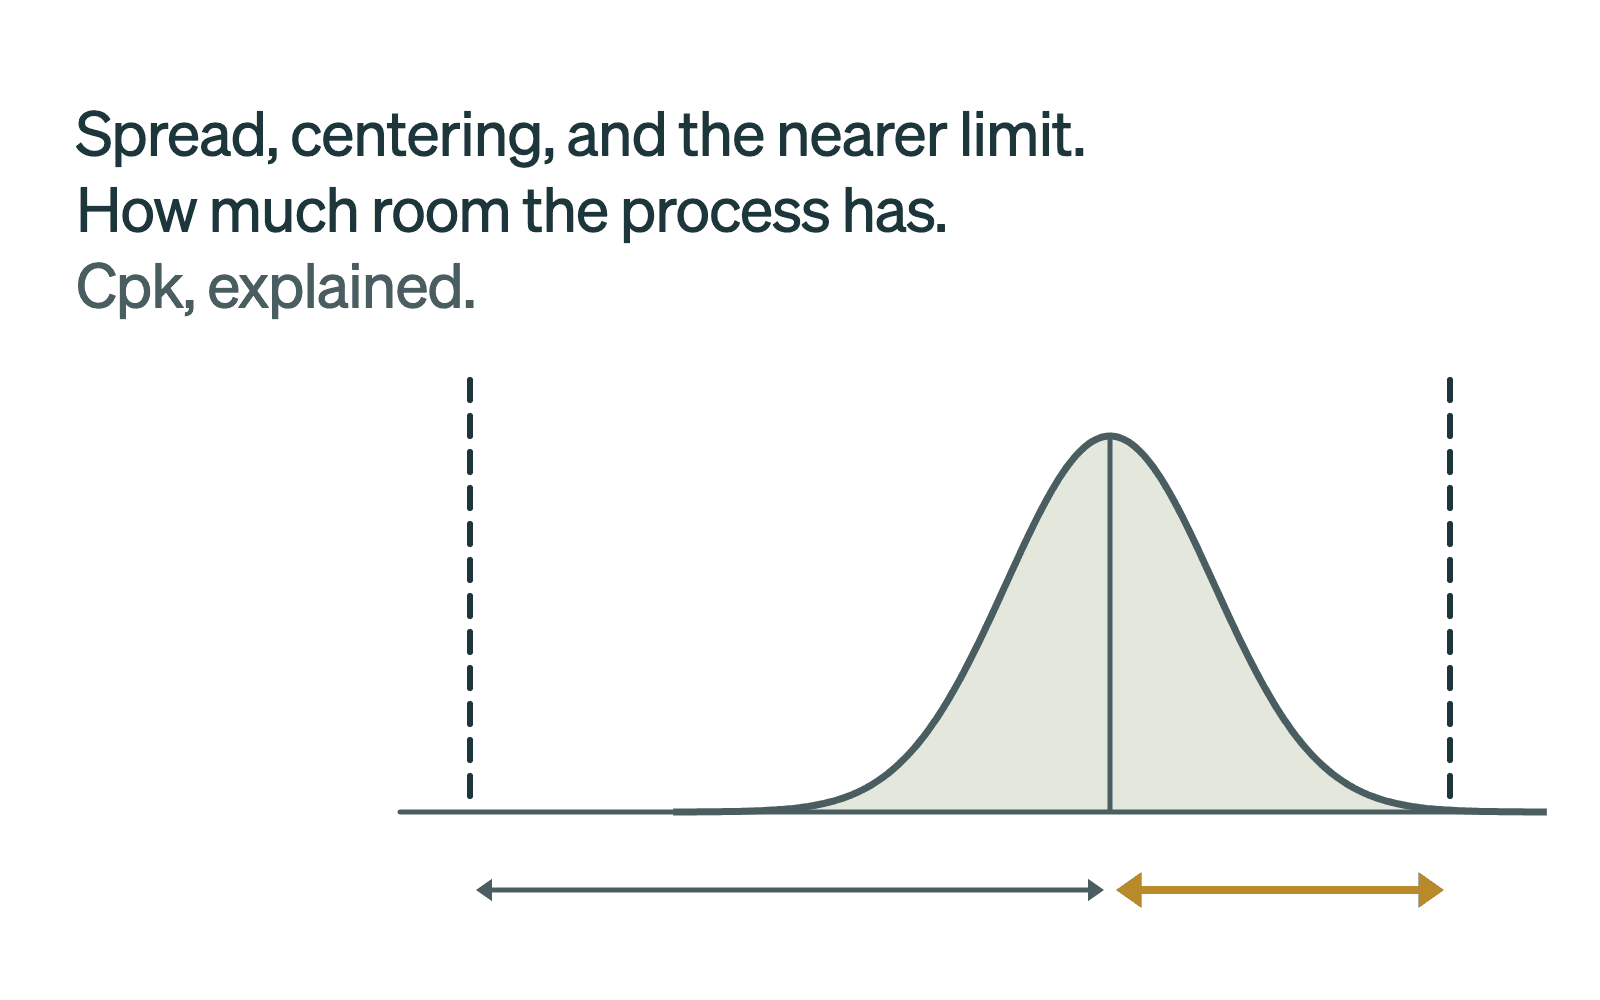
Cpk, the process capability index, measures how well a stable process fits inside its specification limits. It takes the distance from the process mean to the nearer specification limit and divides it by three standard deviations. A Cpk of 1.0 means the nearer limit sits exactly three standard deviations from the mean. Higher is better, and a process whose mean sits outside a limit has a negative Cpk.
For a biologics MSAT or quality team, Cpk is a common tool in continued process verification (CPV), where critical quality attributes (CQAs) and critical process parameters are trended across batches. ISPE describes statistical process control charts and Cpk analysis as the most common CPV tools (ISPE, 2020). As a product nears commercial supply, trending its CQAs becomes an obligation.
The arithmetic takes seconds. The hours go into assembling the data. Teams we spoke with type batch values into Excel, analyze them in Minitab, and remove outliers by hand. At one CDMO, each paper batch record takes about half an hour to transcribe, and a second person checks it.
This explainer covers what Cpk means, the formula with a worked example, how Cpk differs from Cp and Ppk, what counts as a good value, and why capability is harder to read for biologics.
What Cpk means
Every CQA, and many process parameters, has specification limits: a lower limit (LSL), an upper limit (USL), or both. A capability index asks how much room the process leaves inside those limits, measured in units of its own variation. Two things use up that room: spread, and a mean that sits off center.
Cp looks only at spread. It compares the width of the specification with six standard deviations. Cpk also accounts for where the mean sits, so it reports on the side that is closer to its limit. A process can have a good Cp and a poor Cpk if it runs close to one limit.
Capability only means something for a stable process. The NIST/SEMATECH e-Handbook describes it as comparing "the output of an in-control process to the specification limits" (NIST). If a control chart shows shifts or trends, explain them first. A Cpk calculated across them describes a process that does not exist.
The Cpk formula
Here the mean is the process average, σ (sigma) is the within-subgroup standard deviation, and USL and LSL are the upper and lower specification limits. With the overall standard deviation, the same formulas give Pp and Ppk. Cpk is the smaller of the two one-sided indices, Cpu and Cpl. When an attribute has only one limit, use the index for that side alone. An aggregate or host cell protein limit is usually upper only, so Cpu applies. A purity minimum is lower only, so Cpl applies.
A worked example
The numbers here are illustrative, not from a real product. Say a drug substance concentration has a specification of 45 to 55 mg/mL, and a series of batches averages 51 mg/mL with a within-subgroup standard deviation of 1.2 mg/mL.
| Index | Calculation | Result |
|---|---|---|
| Cpu | (55 − 51) / (3 × 1.2) = 4.0 / 3.6 | 1.11 |
| Cpl | (51 − 45) / (3 × 1.2) = 6.0 / 3.6 | 1.67 |
| Cpk | The smaller of 1.11 and 1.67 | 1.11 |
| Cp | (55 − 45) / (6 × 1.2) = 10 / 7.2 | 1.39 |
The spread alone (Cp 1.39) looks comfortable. The process runs 1 mg/mL above the center of the range, so the upper limit is closer, and Cpk is 1.11. Centering the process would lift Cpk to 1.39 without reducing variation at all.
For a lower-only attribute, the same arithmetic uses one side. A monomer purity with a minimum of 95.0%, a mean of 97.2%, and a standard deviation of 0.6% gives Cpl = (97.2 − 95.0) / (3 × 0.6) = 1.22.
Cp, Cpk, Pp, and Ppk
The four indices share two formulas. They differ in which standard deviation goes into them.
| Index | What it compares | Standard deviation | What it answers |
|---|---|---|---|
| Cp | Specification width with six standard deviations | Within subgroup (short term) | How capable the process could be if it were centered |
| Cpk | Distance from the mean to the nearer limit, with three standard deviations | Within subgroup (short term) | How capable the process is, given where it is centered |
| Pp | Specification width with six standard deviations | Overall (long term) | Potential performance over the whole data set |
| Ppk | Distance from the mean to the nearer limit, with three standard deviations | Overall (long term) | How the process actually performed, including drift and shifts over time |
Cpk vs Ppk
Cpk uses the within-subgroup standard deviation, and Ppk uses the overall standard deviation of all the data (Minitab). Within-subgroup variation is short-term variation. With one result per batch, it is usually estimated from the moving range between consecutive batches, so it captures batch-to-batch noise and changes little with slow drift or sustained shifts. Cpk describes short-term capability, and Ppk describes how the process actually performed over the whole period. For a stable process the two come out about the same.
When Ppk is clearly lower than Cpk, the gap is itself the finding: the mean drifts or shifts over time, for example with a raw material lot, a campaign, a site, or an equipment train. Some CPV programs trend Ppk for this reason. A BioProcess International forum on biopharmaceutical control strategy describes using "process capability indices such as Ppk to alert a manufacturer of a process event" (BioProcess International, 2017).
How to run a process capability analysis
- Confirm the process is stable. Plot the data on a control chart and explain any shifts or trends before you calculate anything.
- Check the distribution. All four indices assume normally distributed data. If the data are skewed, transform them or use an index made for non-normal data.
- Choose the standard deviation. Within-subgroup for Cp and Cpk, overall for Pp and Ppk. Report both when you can, because the gap between them is informative.
- Match the index to the limits. Use Cpk or Ppk for two-sided limits, and Cpu, Cpl, Ppu, or Ppl for one-sided limits.
- Report the sample size with the index. A Cpk from ten batches and a Cpk from a hundred are not the same claim.
What is a good Cpk?
Pharmaceutical regulation sets no single number. The FDA's process validation guidance asks for production data to be "statistically trended and reviewed by trained personnel", and for process stability and capability to be evaluated. It does not name an index or a threshold (FDA, 2011). In biopharma, any threshold is a company decision, written into its own CPV procedures.
The widely quoted guidelines come from automotive supplier practice: a Cpk of at least 1.33 for an ongoing process, and a Ppk above 1.67 for a new process, with 1.33 to 1.67 treated as conditional (Steiner, Abraham, and MacKay). NIST gives the share of values outside the limits at each level, for a centered, normally distributed process (NIST):
| Cp (centered process) | Values outside the limits |
|---|---|
| 1.00 | 0.27%, about 2,700 per million |
| 1.33 | About 64 per million |
| 1.66 | About 0.6 per million |
| 2.00 | About 2 per billion |
Why capability is harder to read for biologics
Three things make a biologics Cpk less certain than the formula suggests.
- Few batches. NIST puts the minimum for a capability estimate at about 50 independent values, and recommends 100 or more for a capability study. A drug substance process can produce far fewer batches than that in its first years, and ISPE notes that "far more than three batches will usually be needed". An early Cpk is an estimate with wide uncertainty, so report it with its sample size.
- Non-normal data. Attributes bounded near 100% or near zero, such as purity and impurity levels, are often skewed. NIST suggests a Box-Cox transformation or a non-parametric index for non-normal data. Indices calculated from non-normal data are not directly comparable with those from normal data.
- Shifts over time. Media lots, resin reuse, campaigns, and transfers between sites can move the mean over time. That drift is what separates Ppk from Cpk, and it is why a single index rarely tells the whole story.
Where Cpk shows up in process validation
- Process performance qualification (PPQ). The FDA guidance expects the PPQ protocol to define statistical metrics for variability within and between batches. Some teams use capability indices to express them.
- Continued process verification. Stage 3 of process validation asks for statistical trending of production data. Control charts show whether the process stays in control, and capability indices show how much room it has inside its limits.
- Annual product review. ISPE notes that CPV is now included as part of the annual product review, so capability summaries can end up there.
How Invert fits
Invert brings process and quality data for each batch into one place, so a capability calculation does not start with an export. Assist, Invert's AI analyst, can run the calculation on that data in Python and write the result into a report that keeps the code, the charts, and the narrative together. A reviewer can read the code behind each index. A team can save its method as a Skill, a written method that Assist follows, and run it on a schedule.
Invert does not compute Cpk as a built-in index today. Assist writes the calculation as Python code in each chat, which you can review.
What this means for you
A Cpk is a short summary of a longer question: does a stable process fit inside its limits, with room to spare? Check stability on a control chart first. Report the sample size with the index. Compare Cpk with Ppk to see how much the process drifts over time, and use one-sided indices for one-sided limits. The number is only as good as the batch data behind it, which is why assembling that data cleanly matters as much as the formula.
Frequently asked questions
What does Cpk stand for?
Cpk is short for process capability index. It is the version of Cp that accounts for where the process mean sits between the specification limits.
What does a Cpk of 1.33 mean?
The nearer specification limit is four standard deviations from the mean (1.33 × 3 = 4). For a centered, normally distributed process, NIST's table puts that at about 64 values per million outside the limits.
Can Cpk be negative?
Yes. If the process mean sits outside a specification limit, the distance to that limit is negative, and so is Cpk.
How many batches do you need to calculate Cpk?
NIST treats about 50 independent values as a minimum and recommends 100 or more for a capability study. With fewer batches, report the index with its sample size and treat it as an estimate.
How do you calculate Cpk in Excel?
With 100 batch results in A2:A101 and the limits in cells named USL and LSL, =MIN(USL-AVERAGE(A2:A101),AVERAGE(A2:A101)-LSL)/(3*STDEV.S(A2:A101)) returns an index. Because STDEV.S is the overall standard deviation, that formula gives Ppk. Cpk needs a within-subgroup estimate, such as the average moving range divided by 1.128 for individual values.
Sources
- NIST/SEMATECH e-Handbook of Statistical Methods, 6.1.6: What is process capability?
- ISPE Pharmaceutical Engineering: Continued process verification in stages 1 to 3 (2020)
- FDA: Process validation, general principles and practices (2011)
- Minitab: Process capability statistics, Cpk vs. Ppk
- BioProcess International CMC Forum: Evolution of biopharmaceutical control strategy through continued process verification (2017)
- Steiner, Abraham, and MacKay: Understanding process capability indices (University of Waterloo)